Skip to content

RNA-seq workspace for researchers

From sequencing reads to biological insight—in one reproducible workspace.

Run the pipeline, inspect quality, compare groups, explore pathways, and prepare publication-ready results without installing tools or managing servers.

A State of the Art Reproducible Bioinformatics Pipeline

01

Bring in the data

Start with public or sequenced reads.

Add RNA-seq samples from NCBI accessions or Illumina data, then keep every source file inside the same project.

  • Resolve SRR accessions without manual downloads
  • Import selected Illumina FASTQ files
  • Track source and readiness for every sample
02

Group samples for DE

Turn samples into a clear comparison.

Group replicates by condition, choose a baseline, and make the differential-expression design explicit before compute starts.

  • Create control and treatment groups visually
  • Keep replicates and unassigned samples visible
  • Choose the baseline that defines up and down
03

Set pipeline controls

Control every stage before the run.

Review cleanup, quantification, differential expression, and pathway settings in one run plan. Use guided defaults or open advanced controls when needed.

  • Set controls for each processing step
  • Keep tools, versions, and parameters recorded
  • Review the full plan and runtime estimate
04

Read the result

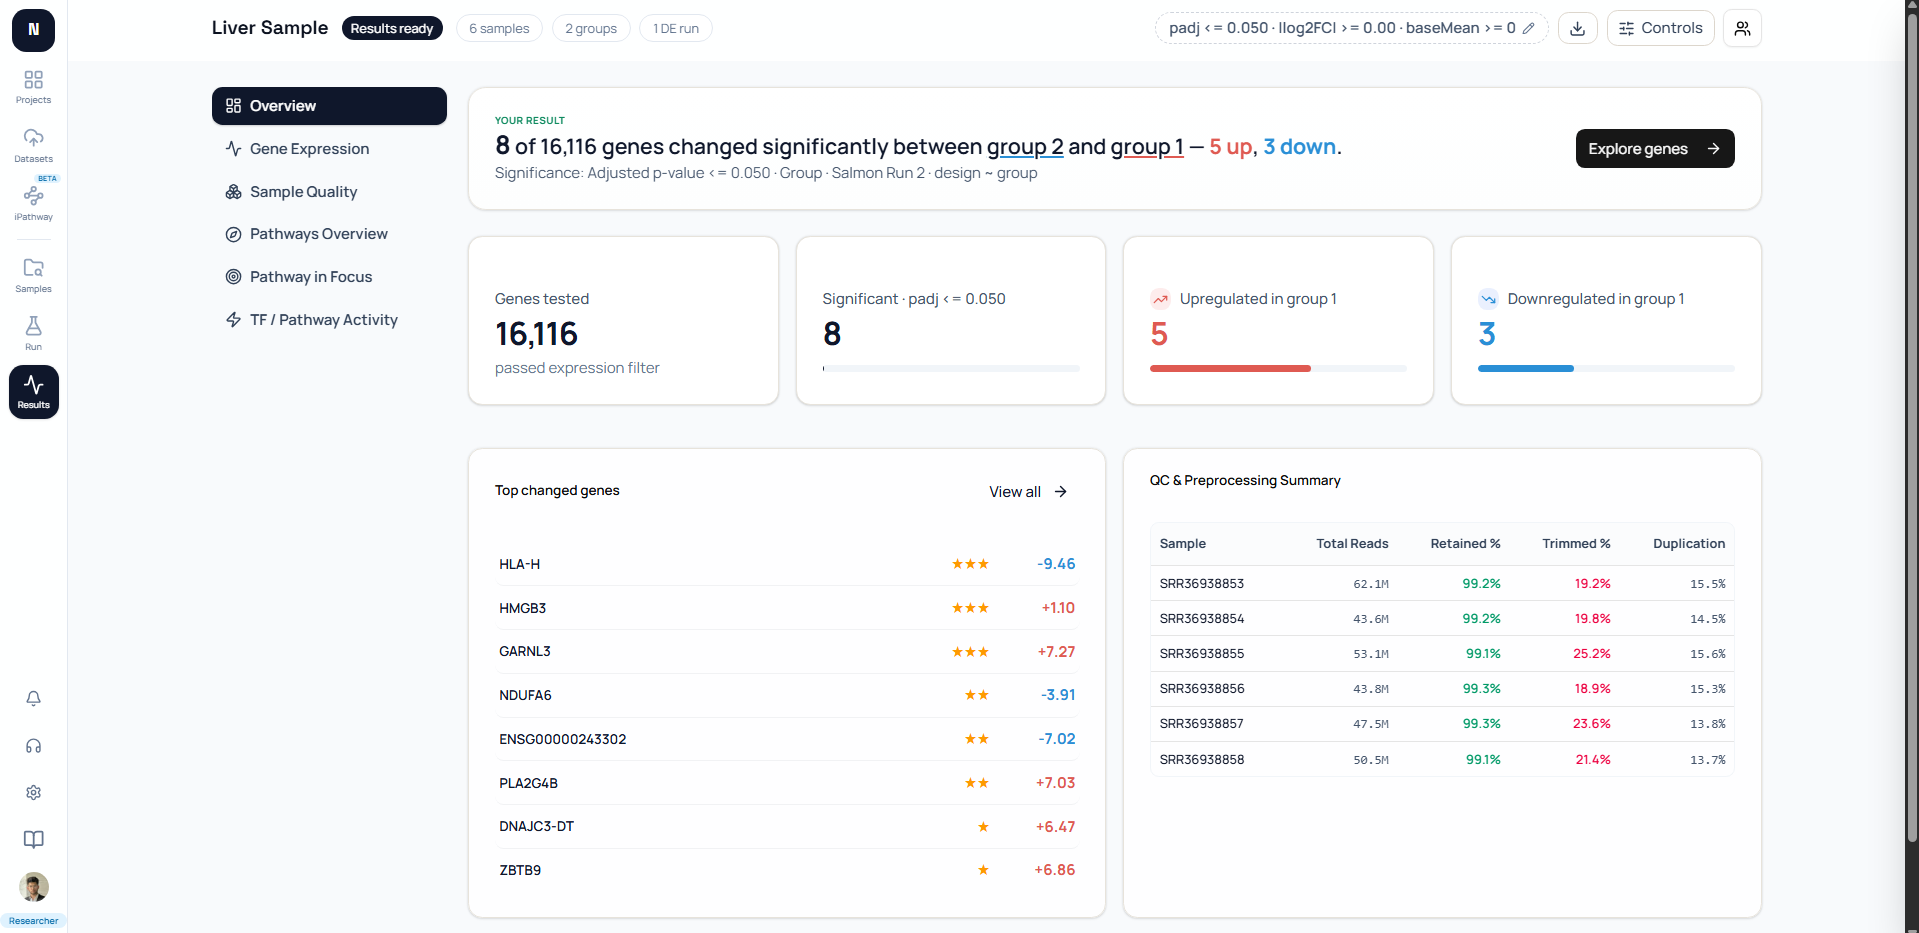
Move from compute to a readable DE result.

Inspect significant genes, sample-level QC, fold changes, and the active comparison without switching between scripts and folders.

  • Live significance and fold-change controls
  • Genes, QC context, and plots together
  • Every result linked to its input run
Differential expression DESeq2 · group 2 vs group 1
Results ready
NotchBio differential-expression overview with significant genes and linked quality measurements.
05

Explore pathway context

Follow changed genes into biology.

Rank pathway signals, inspect member genes, and open focused evidence without losing the active differential-expression comparison.

  • Ranked gene sets across supported collections
  • Leading-edge genes on the active volcano
  • Directional pathway evidence and activity views

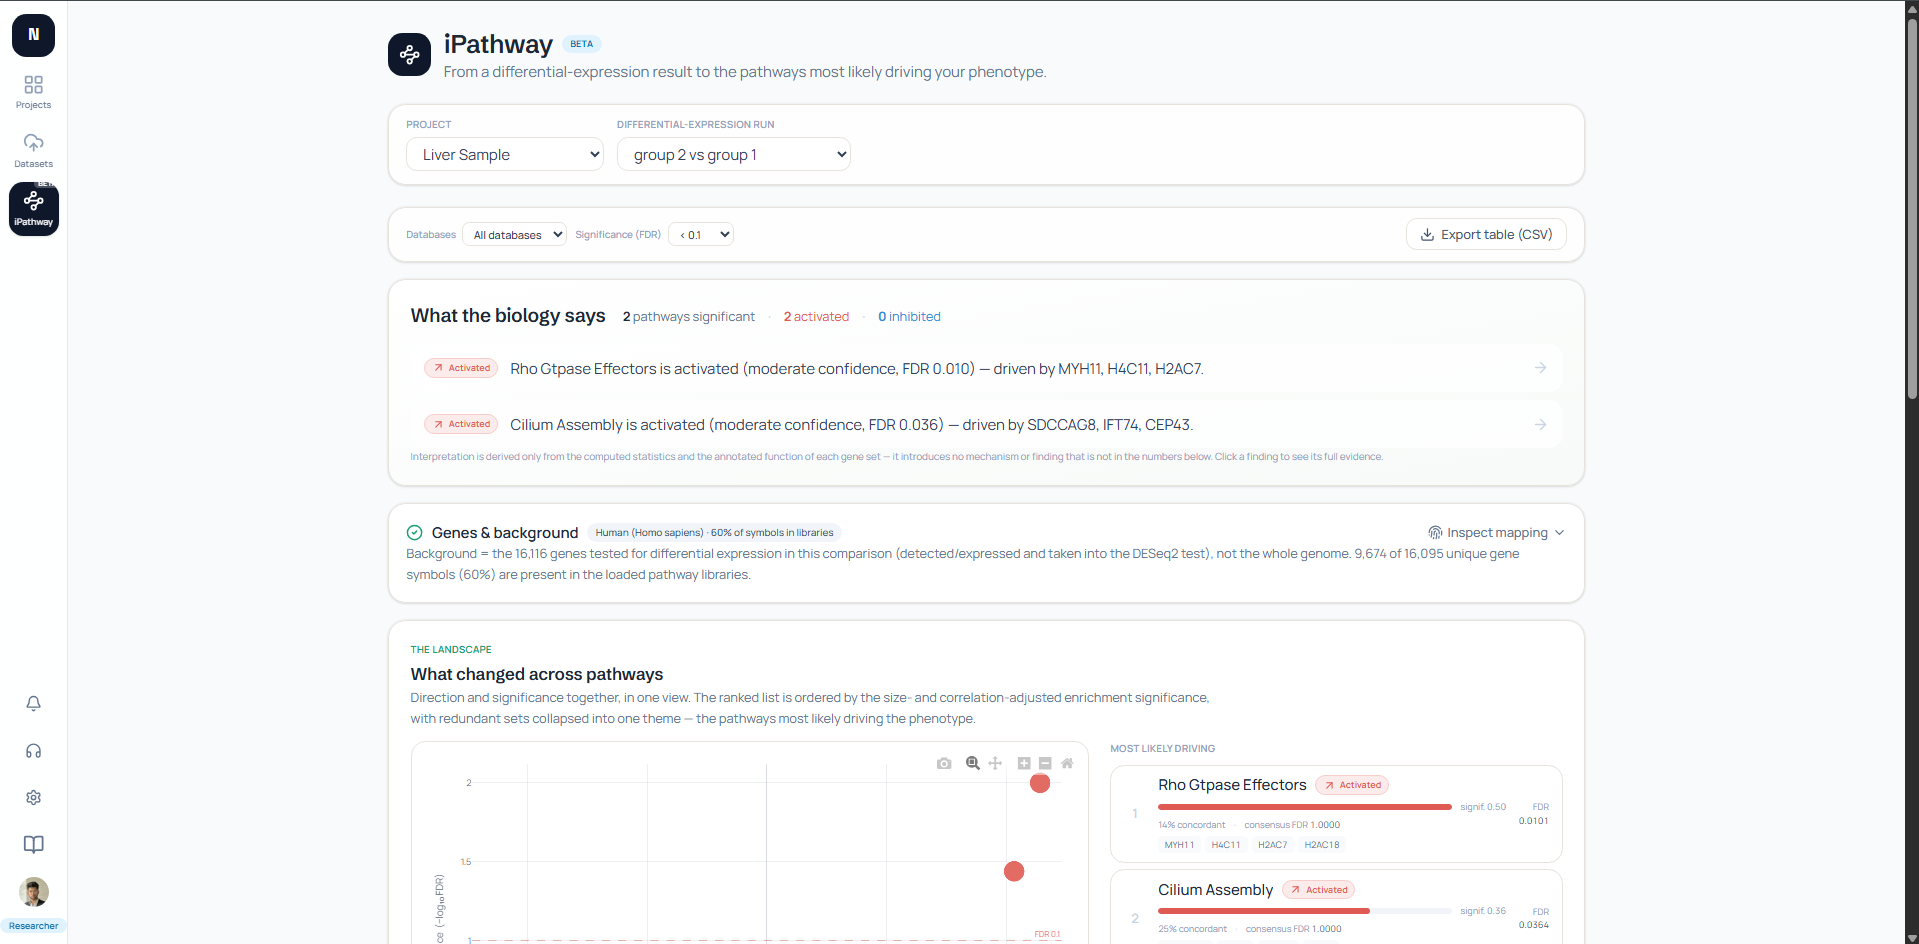
Guided pathway report · Beta

Move from changed genes to pathway evidence

Pathway analysis group 2 vs group 1
Beta
NotchBio pathway analysis showing directional biological findings, tested-gene background, and pathway-level evidence.

Direction

Activated and inhibited signals

Background

Measured genes made explicit

Mapping audit

Matched and unresolved IDs

Evidence

Genes, sources, and run settings

Advanced figure controls

Explore pathway structure without leaving the result

Colour by module or variability Module detail 1–12 clusters Inspect pan, zoom, select, export

Reproducibility by design

The reasoning travels with every result

Input lineage

Every result points back to its samples and processing run.

Quality evidence

QC stays visible beside the comparison you are interpreting.

Statistical context

Design, baseline, cutoffs, and filters remain explicit.

Pathway provenance

Collections, background, mappings, and settings stay auditable.

Spend less time assembling analysis and more time checking the biology.