What Is Log Fold Change? Log2FC in RNA-Seq
Log fold change is the logarithm of the ratio between two conditions. In RNA-seq, log2 fold change of 1 means expression doubled, -1 means it halved, and 0 means no estimated change.
The sign only has meaning after you define the contrast. For treated vs control, a positive log2FC means higher expression in treated samples. Reversing the contrast reverses every sign.
What Is the Log Fold Change Formula?
Log2 fold change is log2(expression in condition A / expression in condition B). The equivalent subtraction form is log2(A) - log2(B) when both values are defined.
log2FC = log2(A / B)fold change = 2 ^ log2FCRNA-seq tools such as DESeq2 do not usually calculate this from two raw sample means. They fit a count model that accounts for library size, dispersion, and the experimental design, then report a model coefficient on the log2 scale.
That distinction matters. The reported log2FC is an estimated condition effect after the design variables in the model, not a raw ratio of two individual count values.
How Do You Interpret Log2 Fold Change?
Convert log2FC back to ordinary fold change with 2^log2FC. Positive and negative values are symmetric around zero, which makes increases and decreases easier to compare.
| Log2FC | Fold change, A/B | Interpretation |
|---|---|---|
| -3 | 0.125 | A is 8-fold lower than B |
| -2 | 0.25 | A is 4-fold lower than B |
| -1 | 0.5 | A is 2-fold lower than B |
| 0 | 1 | No estimated difference |
| 0.585 | About 1.5 | A is about 1.5-fold higher |
| 1 | 2 | A is 2-fold higher |
| 2 | 4 | A is 4-fold higher |
| 3 | 8 | A is 8-fold higher |
A log2FC of -2 is sometimes described as a fourfold decrease. The direct ratio is 0.25, so condition A has one quarter of the expression in condition B.
Why Use Log2 Fold Change Instead of Fold Change?
The log2 scale makes equal proportional increases and decreases equally distant from zero. A doubling is 1 and a halving is -1, while raw fold changes are 2 and 0.5.
The scale is also additive. Two successive doublings correspond to 1 + 1 = 2 on the log2 scale and a fourfold change on the original scale.
This symmetry is why volcano plots place log2FC on the horizontal axis. Genes with higher expression in one contrast direction appear on one side, genes with lower expression appear on the other, and no change is centered at zero.
What Does Positive or Negative Log2FC Mean?
Positive log2FC means the numerator level is higher. Negative log2FC means the denominator level is higher. The labels of the contrast determine which biological group is the numerator.
For a DESeq2 result defined as:
res <- results( dds, contrast = c("condition", "treated", "control"))the coefficient represents treated relative to control. A value of 1 means the fitted expression is twofold higher in treated samples. A value of -1 means it is twofold lower in treated samples.
Never label a gene as upregulated without naming the comparison. “Upregulated in treated relative to control” is clear. “Upregulated” alone is incomplete.
Is Log Fold Change the Same as Statistical Significance?
No. Log2FC is an effect-size estimate, while a p-value or adjusted p-value describes evidence against a null hypothesis under the fitted model.
A large log2FC can be uncertain when counts are low or replicates are variable. A small log2FC can have a low adjusted p-value in a large, precise experiment.
| Quantity | What it answers | What it does not answer |
|---|---|---|
log2FoldChange | How large and in which direction is the estimated effect? | Is the estimate precise? |
lfcSE | How uncertain is the log2FC estimate? | Is the effect biologically important? |
pvalue | How surprising is the statistic under the gene-level null? | Does it control thousands of tests? |
padj | What is the multiple-testing-adjusted evidence? | Is the effect large enough to matter? |
Use effect size and uncertainty together. A DEG rule based only on padj can return tiny but precise effects, while a rule based only on log2FC can return large but unstable estimates.
What Log2 Fold Change Cutoff Should You Use?
There is no universal cutoff. Choose the smallest effect that matters for the biological question, then combine that threshold with multiple-testing control and uncertainty-aware interpretation.
An absolute log2FC threshold of 1 means requiring at least a twofold difference. A threshold of 0.585 means about a 1.5-fold difference. These are reporting choices, not laws of biology.
For an exploratory RNA-seq summary, padj < 0.05 and abs(log2FoldChange) >= 1 is a transparent starting rule when a twofold minimum fits the study. A dosage-sensitive regulator may justify a smaller threshold.
Define the minimum effect before inspecting the winners
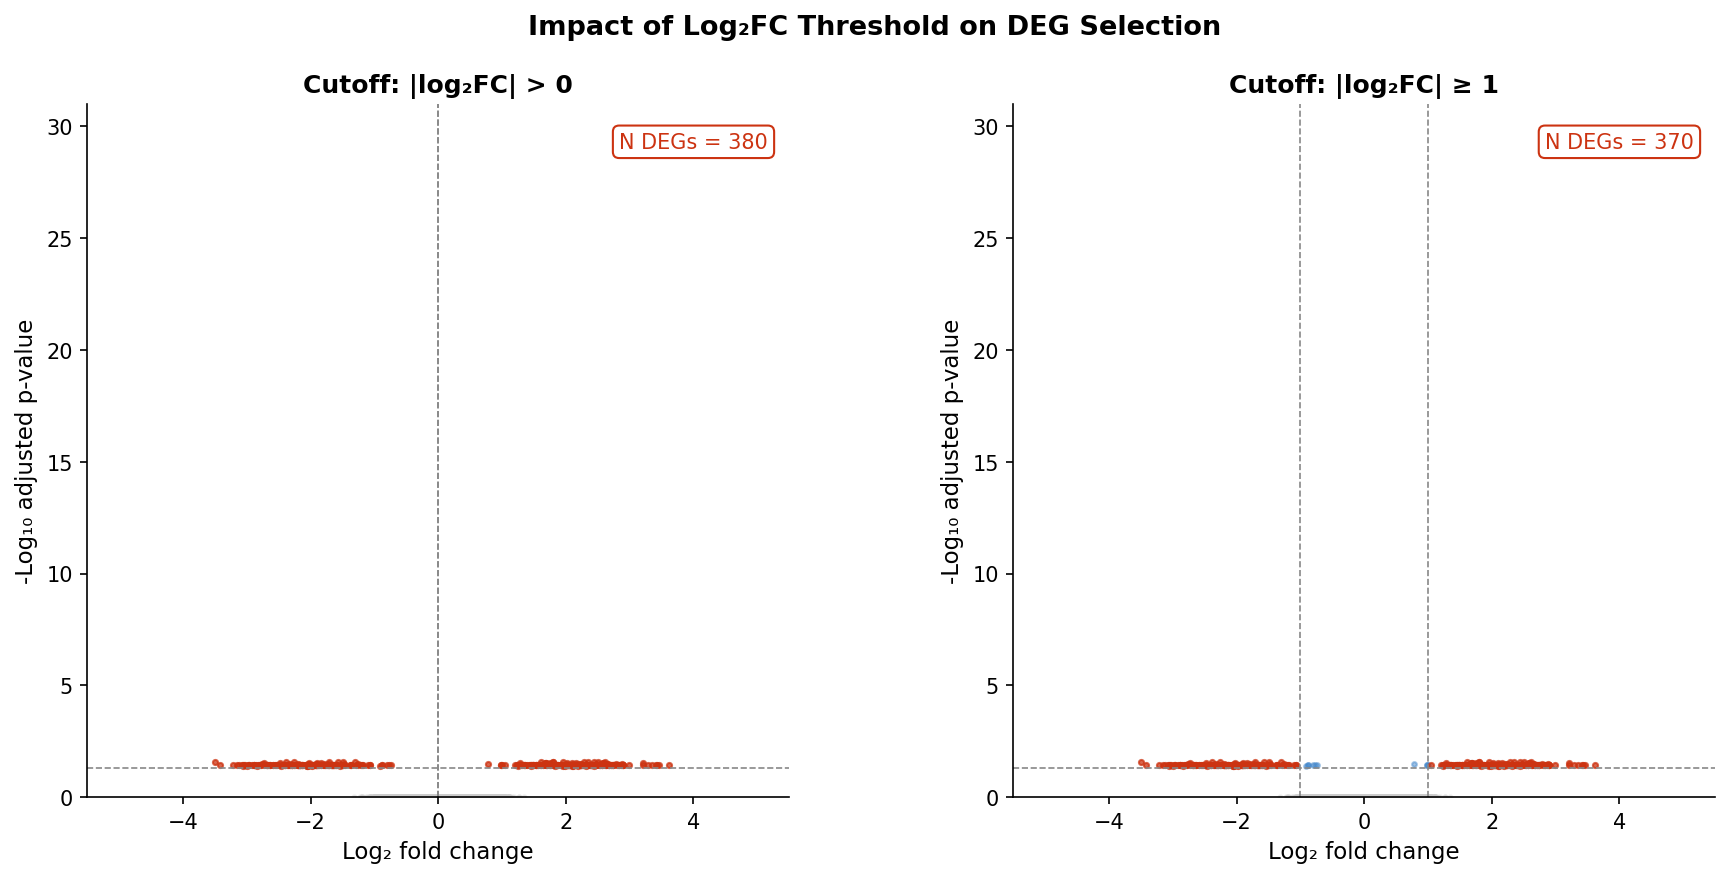
A threshold is most defensible when it follows the scientific question, assay precision, and validation plan. State it in the methods and show sensitivity to nearby choices when the conclusion depends on one cutoff.
An absolute cutoff of zero is not an effect-size filter. Almost every fitted gene has an estimate that is not exactly zero, so abs(log2FoldChange) > 0 leaves the adjusted p-value doing nearly all the selection.
How Should You Test a Minimum Fold Change in DESeq2?
Use lfcThreshold when the scientific null is that the effect does not exceed a chosen magnitude. This tests the threshold directly instead of testing zero and filtering the result afterward.
library(DESeq2)
dds <- DESeq(dds)
res_twofold <- results(  dds,  contrast = c("condition", "treated", "control"),  lfcThreshold = 1,  altHypothesis = "greaterAbs",  alpha = 0.05)
degs_twofold <- as.data.frame(res_twofold) |>  subset(!is.na(padj) & padj < 0.05)
This asks whether the absolute log2FC is greater than 1. It is different from testing whether the effect differs from zero and then retaining estimates above 1.
If the goal is ranking and visualization rather than a thresholded hypothesis test, standard DESeq2 results and shrunken effect estimates may be more appropriate.
What Does lfcShrink Do?
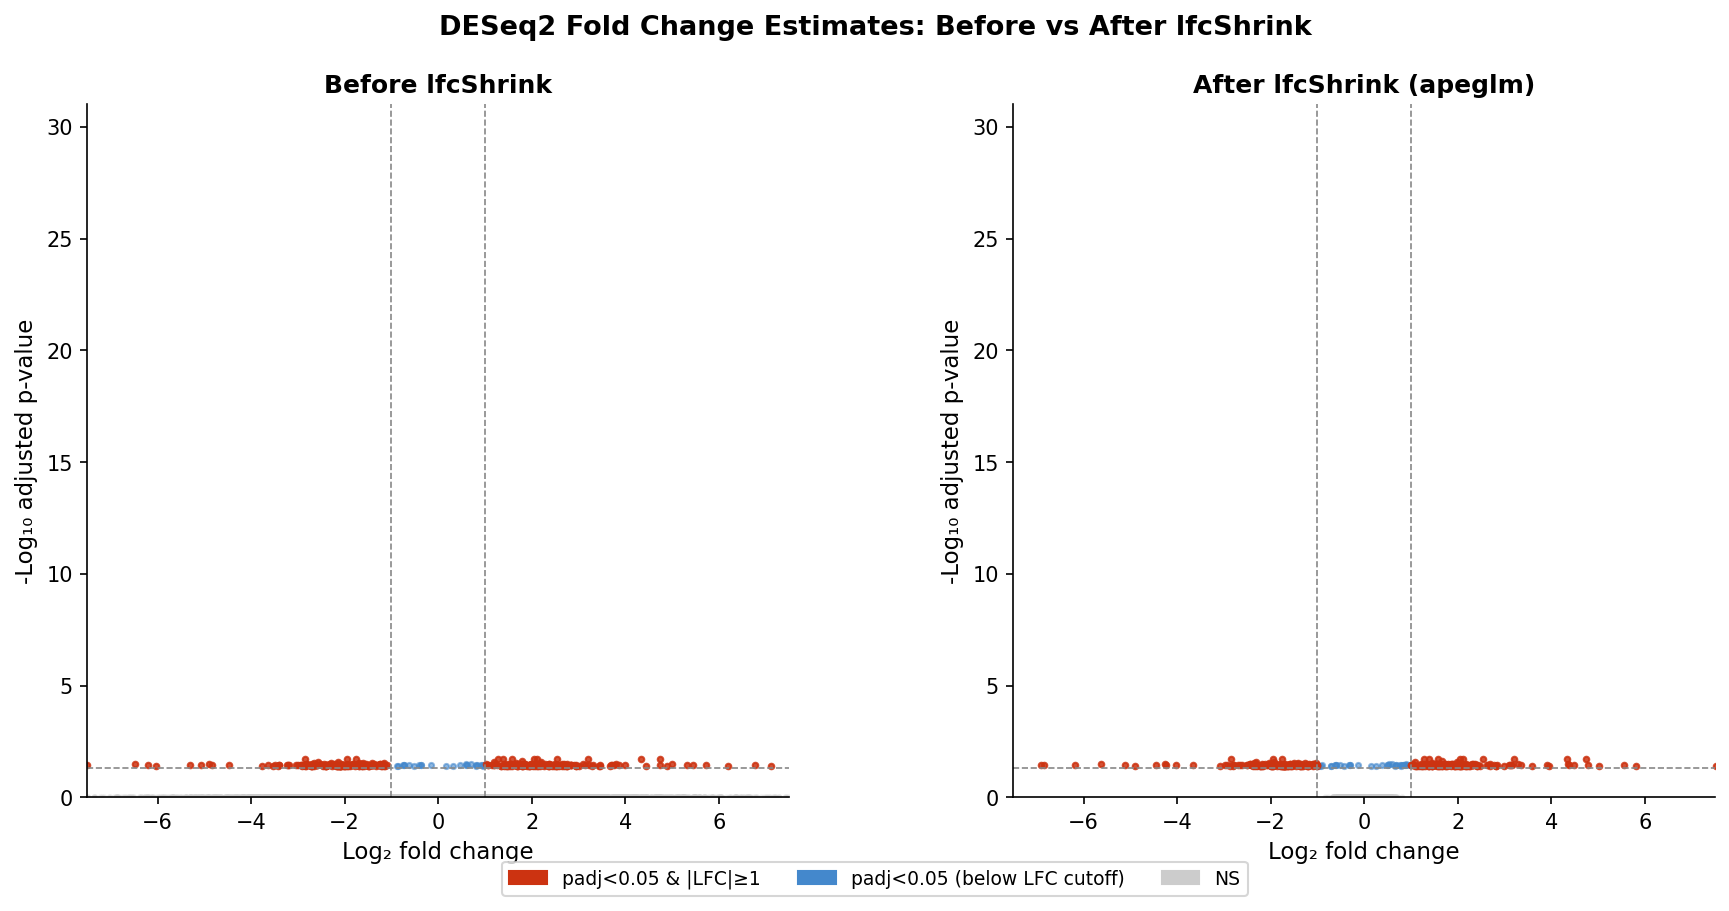
lfcShrink stabilizes noisy log2FC estimates, especially for low-count or high-dispersion genes. It pulls uncertain estimates toward zero while preserving well-supported large effects.
library(DESeq2)library(apeglm)
dds <- DESeq(dds)resultsNames(dds)
res_shrunk <- lfcShrink(  dds,  coef = "condition_treated_vs_control",  type = "apeglm")
res_shrunk_df <- as.data.frame(res_shrunk)
The coefficient name must match resultsNames(dds). The apeglm shrinker uses coef, not an arbitrary contrast vector.
Shrinkage improves effect-size ranking and plotting. It does not turn a noisy experiment into a precise one, and the shrunken estimate should not be mixed silently with p-values from a differently defined contrast.
Why Can Low Counts Produce Large Log2FC Values?
Small absolute count differences can create large ratios when the denominator is near zero. The model reports high uncertainty for these genes, which is why log2FC should not be interpreted without baseMean, lfcSE, and adjusted significance.
Adding a pseudocount before computing a simple ratio can prevent division by zero, but the chosen pseudocount changes the result. It is not a substitute for a count model such as DESeq2, edgeR, or limma-voom.
For single-cell RNA-seq, average log fold-change fields can follow different conventions across tools and versions. Check the function documentation before comparing a Seurat marker statistic directly with a DESeq2 coefficient.
How Does Log2FC Affect Pathway Analysis?
Log2FC can define a DEG cutoff for ORA or provide a signed ranking for GSEA. Those choices change the pathway question and must be documented.
ORA is sensitive to the selected-gene threshold. A very broad list can produce many generic terms, while an overly strict list can miss coherent modest effects.
GSEA avoids a hard gene cutoff by using the complete ranking. The DESeq2 Wald statistic is often preferable to log2FC alone because it accounts for uncertainty, but a prespecified log2FC ranking is still interpretable when its limitations are clear.
See the full pathway analysis in R tutorial for both workflows and the GSEA explainer for leading-edge interpretation.
How Does NotchBio Display Log2 Fold Change?
NotchBio fits DESeq2 once for the selected design, exports log2FoldChange, lfcSE, test statistics, p-values, and adjusted p-values for each comparison, and uses the chosen baseline to define direction.
The current pipeline reports standard DESeq2 effect estimates. It does not silently replace them with lfcShrink output. The Results interface lets researchers filter and sort genes by absolute log2FC while keeping adjusted significance visible.
For pathway runs, NotchBio can rank genes by log2FC or by signed p-value. The product stores that choice with the run, so pathway direction can be traced back to the selected contrast and ranking rule.
Common Log Fold Change Mistakes
The most common errors are reversing the contrast, treating log2FC as a p-value, using zero as a meaningful cutoff, ignoring low-count uncertainty, and calling every positive pathway score activated.
- Write the contrast as
A vs Bbeside each table and plot. - Convert with
2^log2FC, not by doubling the log2FC value. - Use
padj, not rawpvalue, for genome-wide reporting. - Inspect
baseMeanandlfcSEfor extreme estimates. - Distinguish post hoc filtering from an
lfcThresholdhypothesis test. - State whether an effect estimate is shrunken or unshrunken.
- Do not compare coefficients from incompatible models as if they share one scale.
Primary References
The DESeq2 Bioconductor vignette is the primary reference for coefficient direction, threshold tests, independent filtering, and log2FC shrinkage.
The statistical model is described by Love, Huber, and Anders. For adaptive shrinkage, cite the apeglm method paper when that estimator is used.
For a complete count-to-result workflow, continue with the DESeq2 count matrix tutorial and how DESeq2 works.
Further reading
Read another related post
RNA-Seq Batch Correction: ComBat-Seq vs RUVSeq vs sva
How to choose a batch-effect correction tool: ComBat-Seq, RUVSeq, and sva compared, including unknown batch sources and reporting it in your methods.
BioinformaticsHow to Get a Bioinformatics Job in 2026: Hiring Trends
How to get a bioinformatics job in 2026: the skills employers want, why entry-level pipeline roles are changing, and how to build a credible portfolio.
TutorialSalmon to Differential Expression in Python with PyDESeq2
A pipeline-focused PyDESeq2 tutorial: load Salmon quant.sf into a count matrix, fit a DeseqDataSet, run Wald tests, apply apeGLM shrinkage, export DEGs. No R.