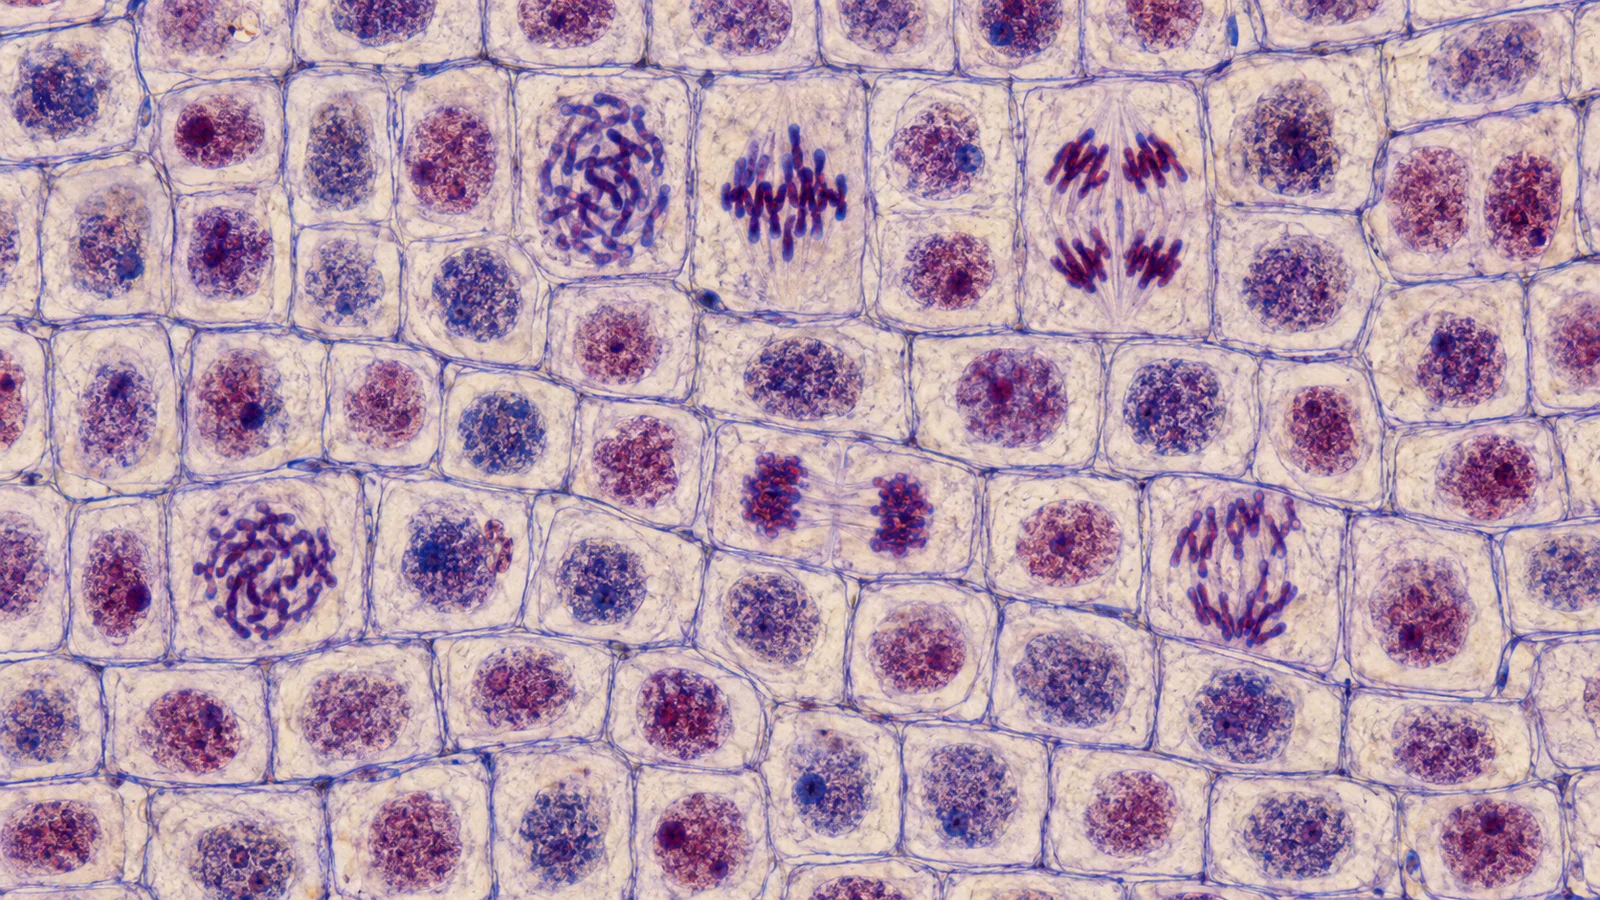
Table 1 Cell Cycle Predictions: Calculate Phase Times
To complete a Table 1 cell cycle prediction, assign plausible times to G1, S, G2, and M so they add to the full cycle. For a 24-hour example, a common benchmark is G1 = 11 hours, S = 8 hours, G2 = 4 hours, and M = 1 hour.
That table is an example, not a universal answer. Cell-cycle timing changes with species, tissue, nutrients, temperature, developmental state, and experimental conditions.
What should Table 1 cell cycle predictions contain?
Table 1 should contain a predicted duration for each cell-cycle stage and a total equal to the cycle length given in the assignment.
If the total cycle is 24 hours, all predicted phase times must sum to 24 hours. Most of that time should usually be assigned to interphase, with a smaller fraction assigned to mitosis.
| Cell-cycle phase | Example prediction | Main event |
|---|---|---|
| G1 | 11 hours | Cell growth and preparation for DNA synthesis |
| S | 8 hours | DNA replication |
| G2 | 4 hours | Growth, DNA checking, and preparation for mitosis |
| M | 1 hour | Chromosome segregation and cell division |
| Total | 24 hours | One complete cell cycle |
These values match a commonly cited example for a rapidly proliferating human cell in culture. The NCBI Bookshelf cell-cycle overview gives approximately 11 hours for G1, 8 for S, 4 for G2, and 1 for M.
Use these values only if the prompt asks for a prediction or a general 24-hour model. If your class provides observed cell counts, calculate from those counts instead.
What is the formula for cell-cycle phase time?
Estimate phase time by multiplying the fraction of observed cells in that phase by the total cell-cycle duration.
estimated phase time = (cells in phase / total cells counted) × total cycle timeFor a 24-hour cycle, a phase containing 20 of 100 observed cells would be estimated as:
(20 / 100) × 24 hours = 4.8 hoursThe method assumes an asynchronous, steadily growing population. Under that model, a stage containing more cells is interpreted as a stage where cells spend more time.
How do you calculate time from onion root tip counts?
Count cells in each visible stage, divide each count by the total, and multiply by the full cycle duration.
Suppose a microscope field contains 100 cells with the following synthetic counts. The numbers below demonstrate the calculation and are not measurements from a real slide.
| Observed stage | Example cells | Fraction | Estimated time in a 24-hour cycle |
|---|---|---|---|
| Interphase | 90 | 0.90 | 21.60 hours |
| Prophase | 5 | 0.05 | 1.20 hours |
| Metaphase | 3 | 0.03 | 0.72 hours |
| Anaphase | 1 | 0.01 | 0.24 hours |
| Telophase | 1 | 0.01 | 0.24 hours |
| Total | 100 | 1.00 | 24.00 hours |
The worked value for metaphase is:
(3 metaphase cells / 100 total cells) × 24 hours = 0.72 hoursConvert hours to minutes by multiplying by 60:
0.72 hours × 60 = 43.2 minutesRepeat the same calculation for every row. The final estimated times should add to the total cycle duration, apart from small rounding differences.
Use the correct denominator
Use all counted cells when estimating time in the complete cycle. Use only mitotic cells if the question asks for the relative share of prophase, metaphase, anaphase, and telophase within mitosis.
Why are most cells in interphase?
Most cells are in interphase because growth and DNA replication usually take much longer than visible chromosome separation.
Interphase includes G1, S, and G2. A cell grows, duplicates DNA, monitors genome integrity, and prepares division machinery during these stages.
Mitosis is visually dramatic but relatively brief. The chromosomes condense, align, separate, and decondense over a smaller portion of the full cycle.
An asynchronous microscope sample therefore contains many cells with diffuse interphase nuclei and fewer cells with condensed mitotic chromosomes.
This does not mean every cell in the tissue is actively cycling. Some differentiated cells may enter G0, a quiescent state outside the active cycle.
Is interphase one stage or three stages?
Interphase contains G1, S, and G2, but those substages are difficult to distinguish in a basic stained onion root tip image.
The chromosomes are not individually visible in the same way as during mitosis. A standard light-microscope worksheet may therefore list interphase as one observable category.
More advanced experiments separate G1, S, and G2 using DNA content, nucleotide incorporation, or molecular markers.
Flow cytometry can distinguish cells with unreplicated and replicated DNA content. EdU or BrdU labeling identifies active DNA synthesis. Cyclins and phosphorylated proteins provide additional phase information.
If Table 1 lists G1, S, and G2 separately, use supplied measurements or a stated benchmark. Do not infer those three values from morphology alone unless the protocol provides a validated method.
How do you predict the stages of mitosis?
Predict prophase as the longest mitotic stage, followed by shorter metaphase, anaphase, and telophase intervals in many introductory examples.
Prophase often contains the most mitotic cells because chromosome condensation and spindle assembly take time. Anaphase is often brief because chromosome separation proceeds quickly once the checkpoint is satisfied.
A simple prediction table might allocate a one-hour M phase as follows:
| Mitotic stage | Example prediction within a 60-minute M phase |
|---|---|
| Prophase | 30 minutes |
| Metaphase | 15 minutes |
| Anaphase | 5 minutes |
| Telophase and cytokinesis | 10 minutes |
| Total | 60 minutes |
This is a teaching example, not a fixed biological schedule. Your observed counts should replace these predictions when data are available.
How do you identify each mitotic stage?
Identify stages by chromosome organization, not by guessing from cell size.
Interphase: The nucleus is intact and chromatin appears diffuse. Individual chromosomes are not clearly resolved.
Prophase: Chromosomes condense and become visible. The nuclear envelope begins to reorganize, and the spindle starts forming.
Metaphase: Condensed chromosomes align near the cell equator. In plant cells, the arrangement may appear as a dark central band.
Anaphase: Sister chromatids separate into two groups moving toward opposite poles. Two diverging chromosome masses are visible.
Telophase: Chromosomes reach the poles and begin to decondense. New nuclei form, and a cell plate may appear in plant cells.
Ambiguous cells should be excluded or scored independently by more than one observer. Forcing every cell into a stage can create systematic counting error.
Why does the percentage of cells estimate time?
The percentage estimates time because a random snapshot of many asynchronous cells samples the amount of time spent in each state.
Imagine photographing a busy intersection at random times. If a traffic-light state lasts longer, more photographs will capture it. The cell-count method uses the same sampling logic.
The NCBI Bookshelf discussion of the eukaryotic cell cycle notes that the fraction of cells observed in mitosis can be used to estimate how long mitosis lasts relative to the full cycle.
The reasoning is statistical. It does not track one cell continuously.
Time-lapse microscopy provides a more direct measurement because it follows individual cells as they enter and leave each stage.
What assumptions does the calculation make?
The calculation assumes cells are sampled randomly, progress through the cycle normally, and have similar probabilities of being observed.
It also assumes the population is near steady state. If a treatment arrests cells in metaphase, a large metaphase fraction reflects arrest, not a normal long metaphase.
Other sources of bias include:
- Counting only the most visually clear cells
- Sampling one unusual region of the root
- Misclassifying early prophase as interphase
- Including dead or damaged cells
- Treating G0 cells as cycling interphase cells
- Using an incorrect total cycle length
- Counting daughter nuclei as independent cells too early
Replicate fields, predefined scoring rules, and blinded counting reduce these errors.
Why can two Table 1 answers differ?
Two correct tables can differ because they may use different organisms, tissues, temperatures, cycle lengths, or observed counts.
Onion root meristem cells are not equivalent to cultured human cells. Even within one root, distance from the growth zone changes the fraction of actively dividing cells.
The assignment may also ask for a prediction before observation, then a calculation after observation. Those columns serve different purposes.
The prediction records your hypothesis. The observed estimate records what the sample supports. A mismatch is not automatically an error; it is a result to explain.
How should you write the conclusion?
State which stage occupied the largest fraction, which mitotic stage was most common, and whether the observations matched the prediction.
A concise conclusion might read:
Most observed cells were in interphase, so interphase was estimated to occupy most of the 24-hour cycle. Prophase was the most common mitotic stage. The calculated values differed from the prediction, which may reflect biological variation and stage-classification error.
Do not claim that counting proves an exact universal duration. Report the total cells, formula, assumed cycle length, rounding rule, and important limitations.
Key takeaways
For a general 24-hour prediction, G1 = 11 hours, S = 8 hours, G2 = 4 hours, and M = 1 hour is a defensible benchmark.
For an observed cell-count table, use (cells in stage / total cells) × cycle time.
Use all cells for complete-cycle estimates and only mitotic cells for proportions within mitosis.
Treat the result as an estimate based on an asynchronous population, not a direct stopwatch measurement of one cell.
Further reading
Read another related post
Nextflow vs No-Code RNA-Seq Pipelines: Which Fits Your Lab?
Nextflow is powerful and steep. No-code platforms are fast and constrained. A clear decision framework for which fits your lab today, and when to use both.
BioinformaticsGTF vs GFF3 Files: Format Differences and RNA-Seq Fixes
GTF and GFF files from the same database often disagree, prokaryotic files lack exon features, AGAT fixes some and breaks others. A practical field guide.
BioinformaticsBioinformatics in Industry: Skills and Workflow Standards
Most commercial bioinformatics runs on academic instincts. A senior practitioner view on what industry needs and the engineering practices that close the gap.