What Is a Biological Pathway?
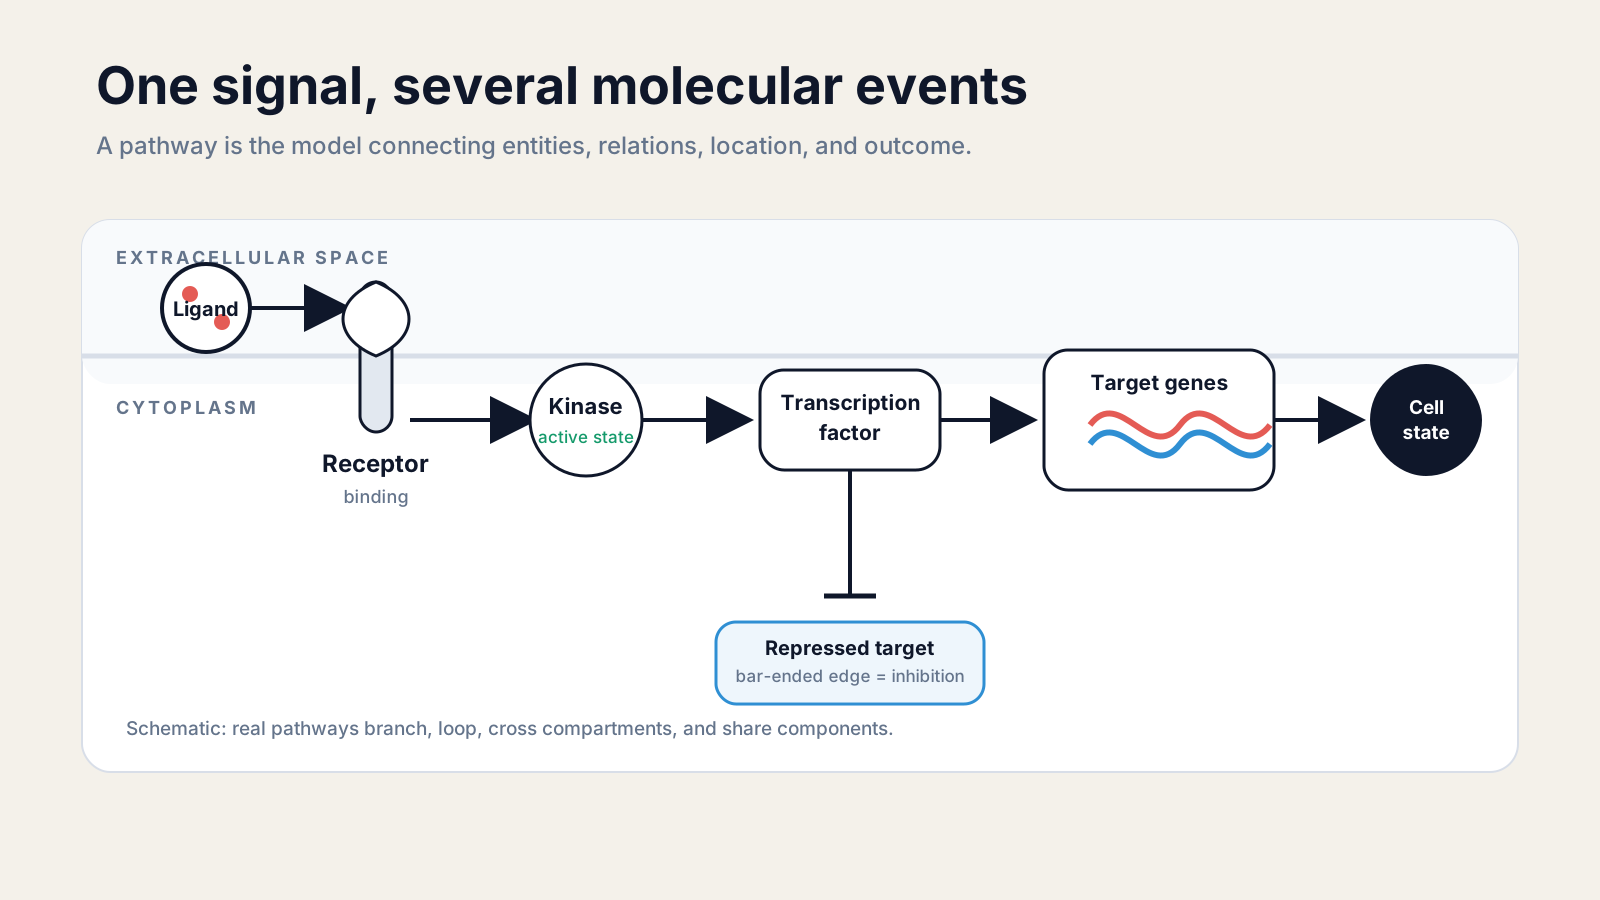
A biological pathway is a connected series of molecular events that changes a cell’s state or produces an outcome, such as gene expression, metabolism, movement, or division.
That short definition hides an important detail: a pathway is a scientific model. It selects relevant molecules and relations from a cell whose biology is larger, context-dependent, and densely connected.
This guide explains the parts of a pathway, the main pathway types, and the difference between a pathway, a gene set, a diagram, and a biological network. It also shows how those representations appear in NotchBio.
What is a biological pathway?
A biological pathway is a curated model of molecular actions that links an input or starting state to a biological product, response, or change in cell state.
The NHGRI Biological Pathways Fact Sheet describes pathways as actions among cellular molecules that lead to a product or cellular change. Examples include making a protein, turning genes on, moving a cell, or responding to a signal.
“Series” does not always mean a straight chain. Feedback loops can reinforce or dampen a response. Parallel branches can reach the same output. One component can participate in several pathways, and the relevant route can change with cell type, dose, time, or environment.
Pathways are therefore useful abstractions, not literal pipes inside a cell. A pathway name gives researchers a stable unit for describing, testing, and communicating a biological mechanism whose full context may be much more complicated.
What are the parts of a pathway?
A pathway contains biological entities, molecular events, relations between them, cellular context, and an outcome that gives the sequence a coherent biological meaning.
Entities can include genes, RNAs, proteins, protein complexes, metabolites, drugs, ions, organelles, and phenotypes. The same gene may appear as DNA, transcript, protein, or modified protein because those states are not biologically interchangeable.
Relations describe what happens between entities. Common examples include binding, catalysis, transport, phosphorylation, transcription, activation, inhibition, synthesis, and degradation. Direction matters because A → B does not mean the same thing as B → A.
Sign matters too. An activating edge and an inhibitory edge predict opposite consequences. A down-regulated inhibitor can release its target, so simply averaging member-gene fold changes can miss the pathway’s wiring.
Location adds another constraint. A receptor at the plasma membrane, a kinase in the cytoplasm, and a transcription factor in the nucleus can form one signaling route. Removing compartments may make a diagram simpler while also removing mechanistic meaning.
Finally, the pathway needs an outcome. The endpoint might be a metabolite, a transcriptional program, apoptosis, proliferation, or another measurable phenotype. That outcome explains why the selected events belong together.
What types of biological pathways exist?
The main pathway types are metabolic, signaling, gene-regulatory, and cellular-process pathways, although real database records often combine more than one type.
Metabolic pathways transform small molecules through enzyme-catalyzed reactions. Glycolysis is the familiar example: each reaction consumes substrates, produces products, and depends on enzymes and cellular conditions.
Signaling pathways carry information from a cue to a response. A ligand may bind a receptor, change kinase states, alter a transcription factor, and affect target genes. These pathways often contain branches, feedback, cross-talk, and transient protein modifications.
Gene-regulatory pathways describe how transcription factors, chromatin regulators, and non-coding RNAs influence gene expression. Their edges can represent direct regulation, prior-knowledge associations, or experimentally inferred effects, so provenance is essential.
Cellular-process pathways organize broader programs such as the cell cycle, DNA repair, apoptosis, immune response, or vesicle transport. They may contain nested subpathways and many events rather than one compact biochemical chain.
The categories overlap. A signaling pathway can change transcription, which changes enzyme abundance, which alters metabolism. The label helps navigation, but it does not create a hard biological boundary.
Is a pathway the same as a gene set?
No. A pathway describes biological entities and relations, while a gene set is a membership-only list that usually discards order, direction, edge sign, molecular state, and compartments.
A GMT gene-set record is simple: a pathway name, a description or source, and member genes. That compact structure is ideal for asking whether pathway members are overrepresented in a selected list or shifted in a ranked list.
Membership cannot tell you whether one gene activates another, whether a protein moved between compartments, or whether an inhibitor sits upstream. A significant gene-set result is therefore evidence about coordinated membership, not proof that the full mechanism is activated.
A graph retains more structure. Nodes represent entities, and edges record direction and often sign. A topology method can use that wiring, but only where the graph and measured nodes have enough coverage.
A weighted regulator-target network is different again. It links a source, such as a pathway or transcription factor, to targets with signed weights. It supports footprint-based activity inference, not a reconstruction of every internal pathway event.
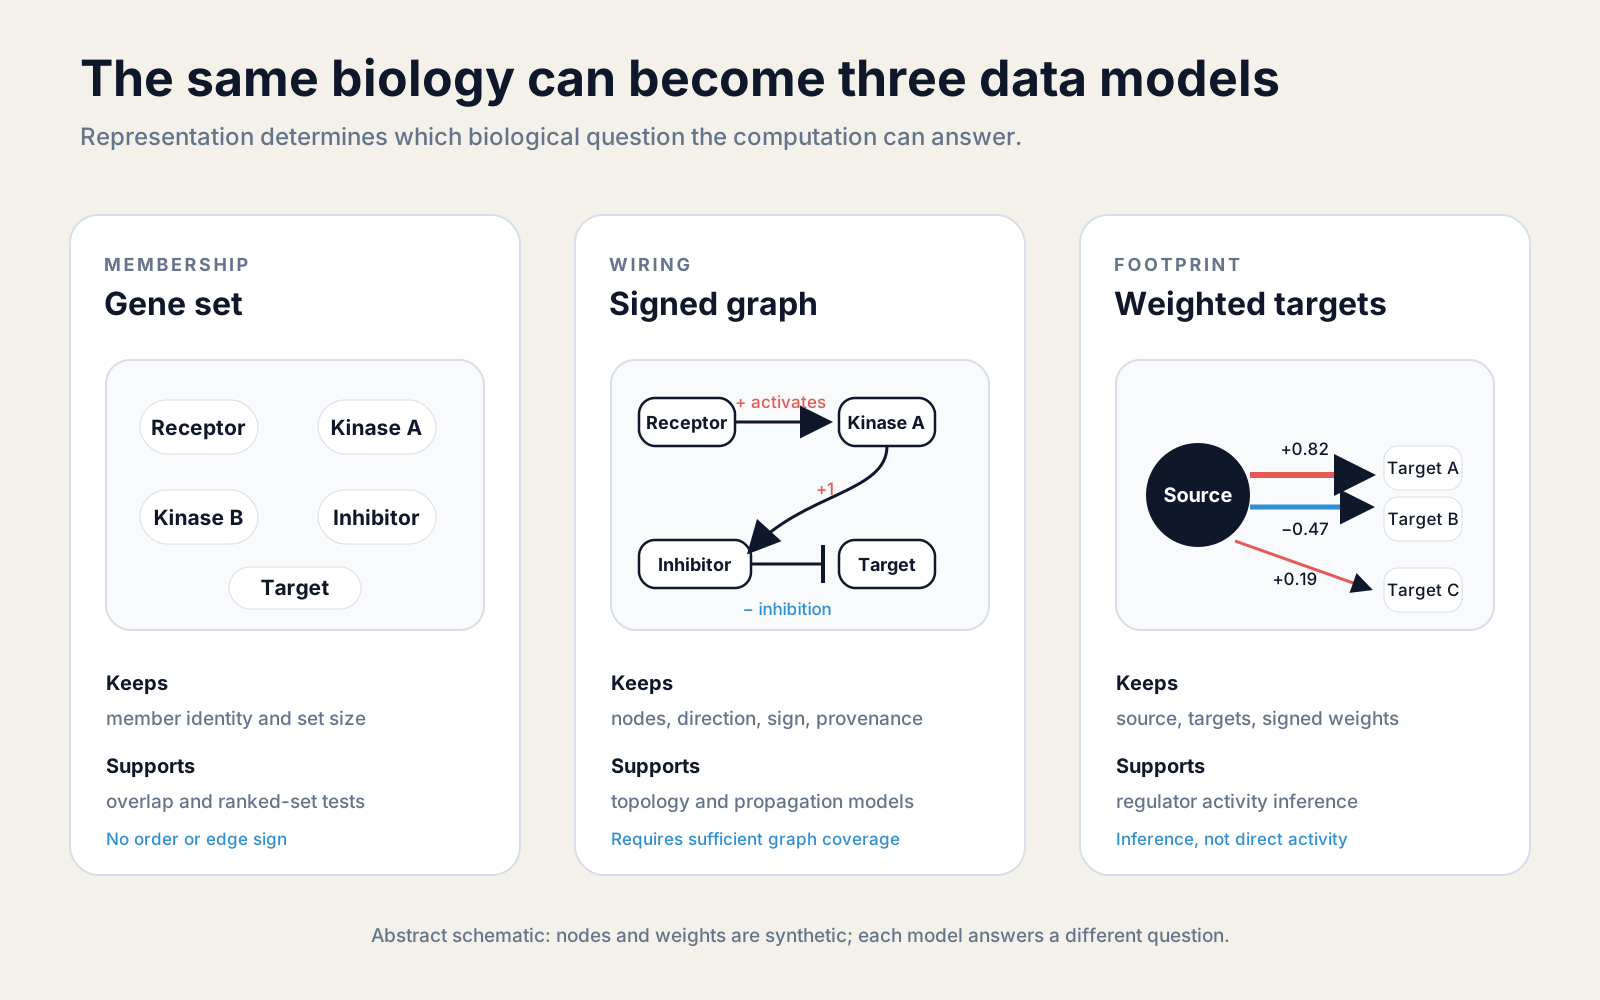
This distinction is the foundation for interpreting pathway enrichment analysis correctly. Enrichment, topology propagation, and activity inference can agree, disagree, or be unavailable because they test different evidence layers.
How do pathways form biological networks?
Biological pathways form networks when they share molecules, exchange signals, regulate one another, or converge on the same cellular outcome.
The NHGRI notes that pathways often lack absolute boundaries and work together. A MAPK component may connect growth-factor signaling to proliferation, stress response, or differentiation. A metabolite can connect several metabolic routes without belonging exclusively to one.
Researchers can define pathway connections in several ways. Two pathways may share member genes, leading-edge genes, regulators, metabolites, or curated edges. They may also show correlated expression in a dataset.
Those edge definitions are not equivalent. Shared membership comes from a database. Co-expression comes from the measured samples. A regulator-target edge comes from prior knowledge. Correlation alone does not establish regulation or causality.
The chosen definition should travel with the network. A pathway-to-pathway edge labeled “Jaccard overlap” communicates a set relationship. Calling the same edge “regulation” would claim a mechanism that the overlap does not prove.
How are pathways represented in databases?
Pathway databases represent biology as curated events, diagrams, gene sets, graphs, or combinations of these forms, with different boundaries and levels of detail.
In the Reactome data model, events are core building blocks. Reaction-like events convert inputs into outputs, while a pathway groups related events. Complexes are distinct entities, and the events that assemble them can be modeled explicitly.
Reactome diagrams show connected molecular events and cellular compartments. WikiPathways emphasizes community-curated models. MSigDB distributes collections as gene sets, even when a source database contains richer structure.
Standard notation helps readers interpret diagrams consistently. The Systems Biology Graphical Notation defines complementary languages for process descriptions, activity flows, and entity relationships rather than treating every arrow and box as self-explanatory.
A good pathway record also carries provenance: database, release, organism, identifier space, evidence, and license. Version changes can alter membership or wiring, so reproducible analysis records the exact library or graph snapshot used.
How does NotchBio show a pathway?
NotchBio shows a pathway through separate membership, topology, and weighted-target views, keeping each score tied to the representation that produced it.
In the backend, membership-only GMT libraries are loaded as pathway names and gene-symbol lists. The current collections include Hallmark and curated pathway databases such as WikiPathways, Reactome, KEGG Medicus, BioCarta, and PID when their pinned files are present.
Signed pathway graphs are loaded separately from pinned JSON snapshots. Their nodes, directed edges, edge signs, database versions, and graph fingerprint support topology-based perturbation analysis without pretending every gene set has usable wiring.
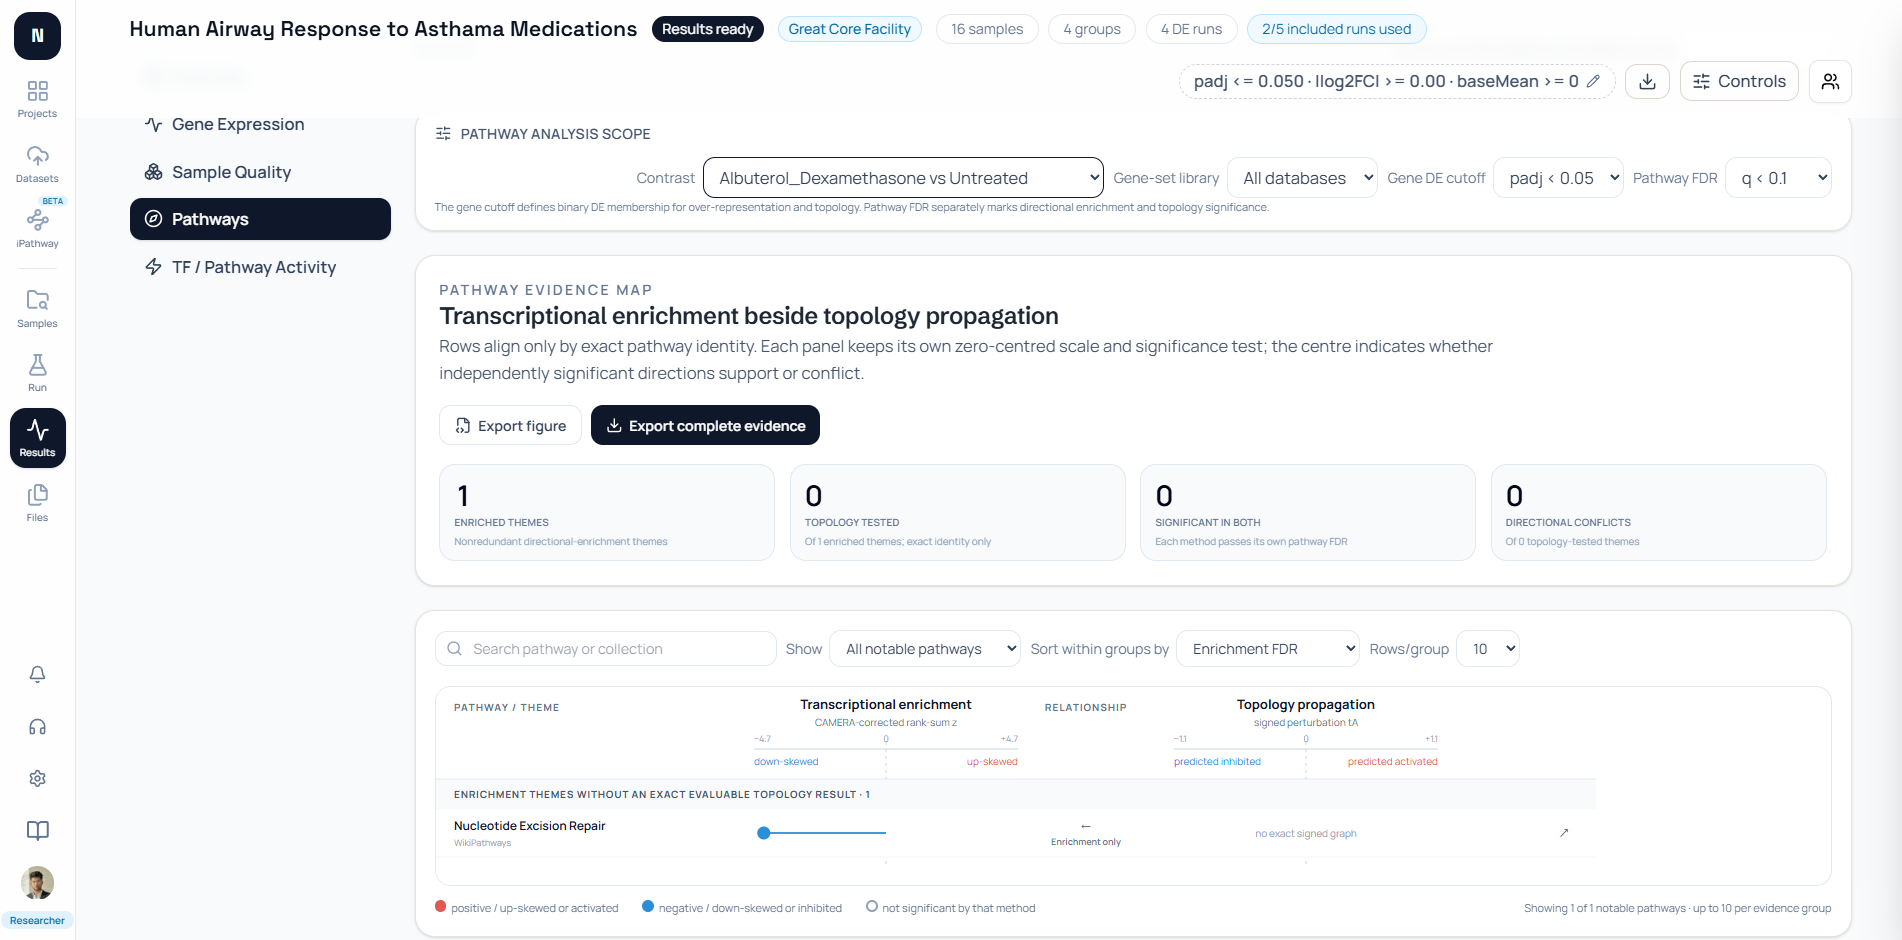
The Results Pathways evidence map preserves that distinction visually. It aligns directional enrichment with topology propagation only by exact pathway identity and gives each method its own zero-centered axis and significance test.
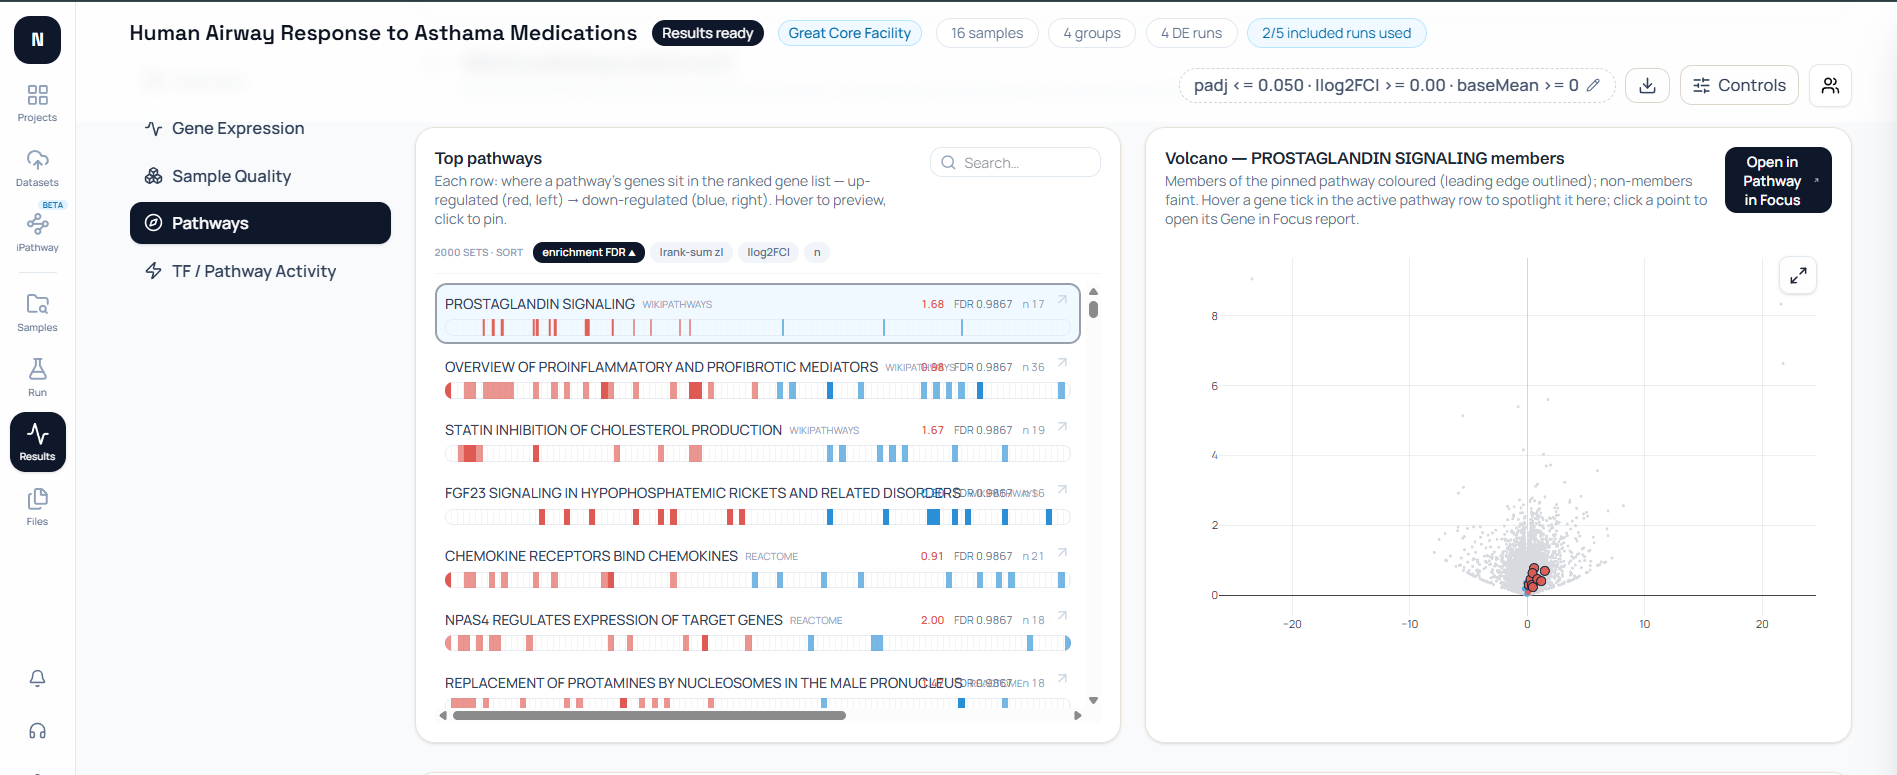
Selecting a pathway then connects the set-level result to measured genes. The barcode shows where members fall in the ranked gene list, while the neighboring volcano highlights those members in the current comparison.
The TF / Pathway Activity area uses another model: signed weighted prior-knowledge targets. PROGENy is the default pathway network, and the score is inferred from target-gene statistics with a univariate linear model.
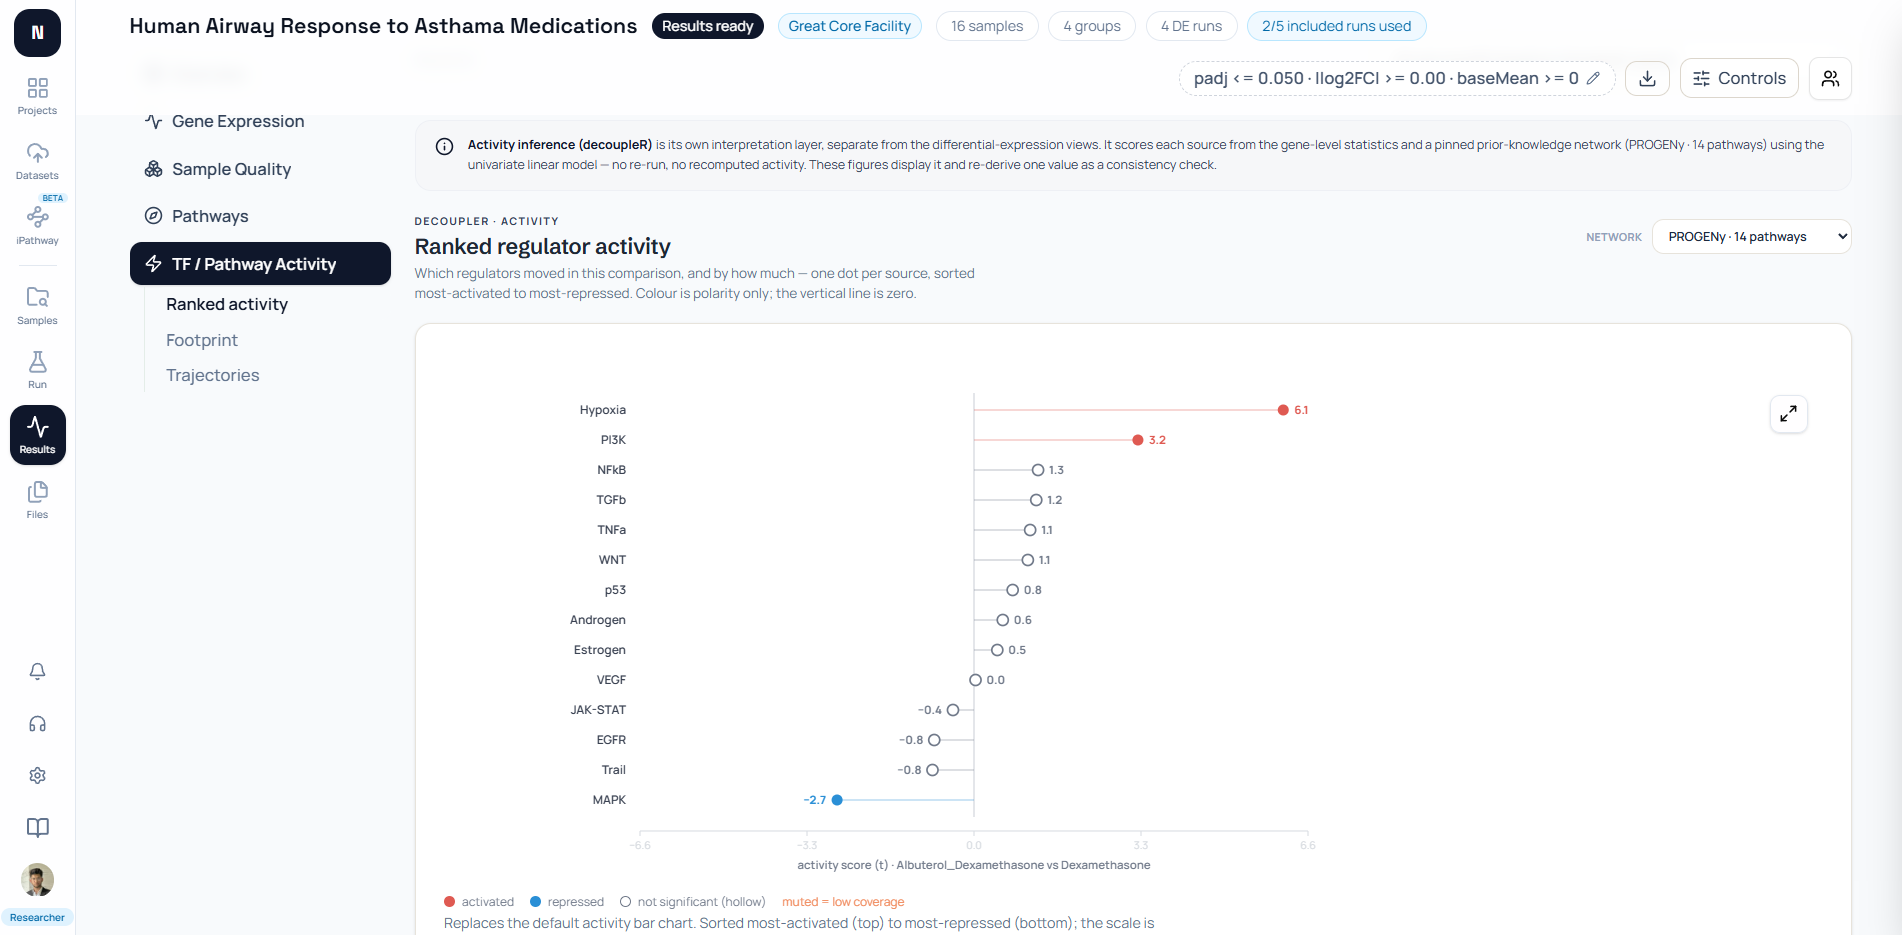
This separation is deliberate. Member expression is observed gene behavior. Directional enrichment is a ranked-set pattern. Topology propagation uses signed wiring. Activity inference tests a weighted footprint. None is a universal pathway score.
What can a pathway model leave out?
A pathway model can omit cell type, timing, dose, molecular state, spatial context, alternative routes, weak evidence, and interactions that have not yet been curated.
Pathway databases are biased toward studied organisms, diseases, genes, and mechanisms. A missing pathway score may mean the graph is absent, identifiers failed to map, or too few nodes were measured. It does not mean the biology is absent.
Boundaries can also create false independence. Two database pathways may share many genes or events yet appear as separate rows. Conversely, one broad pathway can contain several mechanisms that respond in opposite directions.
RNA-seq adds another limitation: it measures transcripts, not most protein states, metabolite concentrations, reaction rates, or spatial interactions. Transcript changes can support a pathway hypothesis without directly measuring biochemical flux.
Treat a pathway diagram as a testable summary. Ask which entities and relations it preserves, what data were measured, which database version defined the model, and what conclusion the analysis method is actually licensed to make.
The next step is What Is Pathway Analysis?, which turns these representations into specific questions, inputs, tests, and outputs. For the ranked-set method in depth, read what GSEA tests and why it differs from a DEG list.
Further reading
Read another related post
STAR vs Salmon vs HISAT2: A Hands-On Benchmark
A hands-on RNA-seq aligner benchmark: working STAR, Salmon, and HISAT2 commands, real runtime and memory numbers, and how much the DEG list actually changes.
TutorialSalmon From FASTQ to Counts: A Complete Tutorial
A complete Salmon tutorial with decoy-aware indexing, quantification flags explained, tximport into R, DESeq2 integration, and QC checks at every step.
Research GuideRNA-Seq Results Checklist for Publication and Peer Review
Reviewers reject RNA-seq papers for predictable reasons: missing FDR correction, version-less methods, inaccessible data. A checklist that prevents it.