What Is Pathway Analysis?
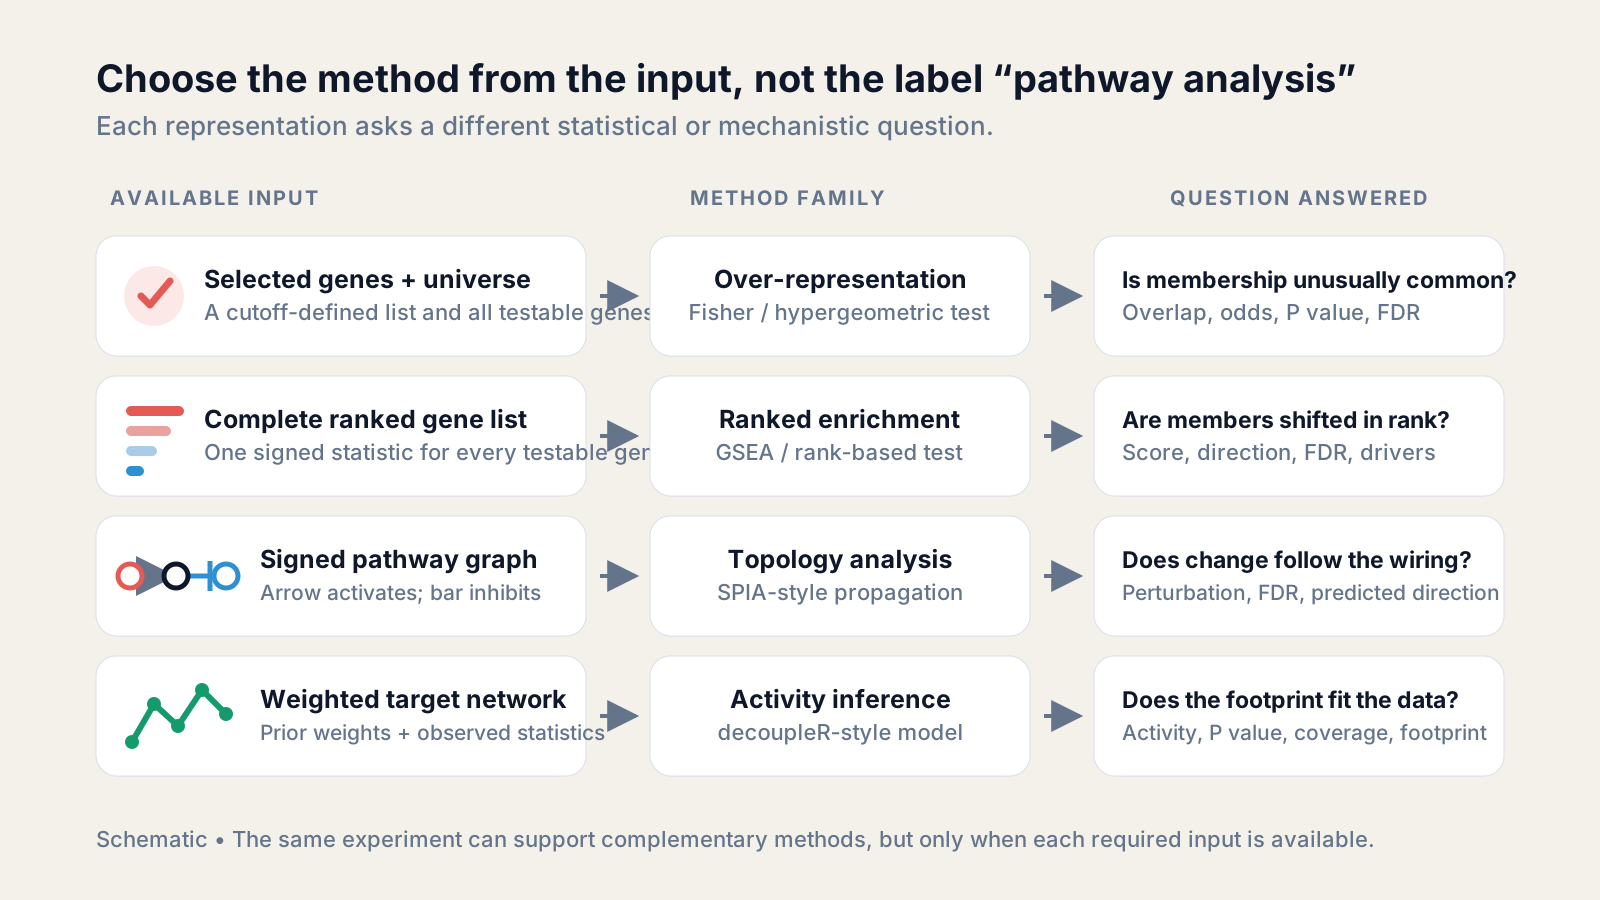
Pathway analysis tests whether measured genes collectively support a biological process, pathway graph, or regulator model. Choose the method from the input: a list, ranking, graph, or weighted network.
That definition matters because “pathway analysis” is not one algorithm. It is a family of methods that ask different questions about different representations of biology.
If the boundary between a pathway, gene set, and network is still unclear, start with What Is a Biological Pathway?. This guide begins where that definition ends: testing measurements against the model.
An RNA-seq study can support several of these methods at once. Their results may complement each other, but they are not interchangeable and should not be forced into one universal pathway score.
What is pathway analysis?
Pathway analysis converts gene-level measurements into tests of coordinated biology. It asks whether genes linked by annotation, rank, wiring, or regulation behave more coherently than expected under a stated null model.
The input often comes from differential expression, but a pathway method does not repair the upstream experiment. Sample identity, replication, design terms, contrasts, quality control, normalization, and gene-level modeling must already be defensible.
The method then brings in prior knowledge. A pathway database may supply a gene set, a signed directed graph, or a weighted regulator-to-target network. Those objects describe different evidence and therefore produce different statistics.
Gene-set tests also differ in their null hypotheses. A competitive test compares genes inside a set with genes outside it. A self-contained test asks whether the set shows any association with the phenotype without requiring the rest of the measured genome as its comparator.
That distinction changes what “significant” means. Two tools can accept similar tables and return pathway FDR values while testing different nulls. The method name, test family, and permutation or approximation scheme therefore belong in every report.
A useful result connects four objects: the measured gene universe, the biological model, the statistical test, and the reported uncertainty. If one is missing, the pathway label alone is not enough to interpret the output.
What data can pathway analysis use?
Pathway analysis can use a selected gene list, a complete ranked list, per-gene changes on a pathway graph, or gene statistics paired with weighted targets. Raw counts usually need gene-level modeling before these tests.
A selected list contains genes that pass a declared rule, such as FDR below 0.05 and an absolute log2 fold change above 1. It must be paired with the genes that could have been selected, called the measured or tested universe.
A ranked list assigns one numeric statistic to every usable gene. The statistic should preserve direction and evidence. Examples include a Wald statistic or signed transformation of a P value, with duplicate identifiers resolved before ranking.
A topology method needs more than membership. It needs nodes, directed edges, activation or inhibition signs, measured gene changes, and graph provenance. Coverage matters because a graph cannot be propagated honestly when most nodes or edge signs are unavailable.
An activity model needs observed gene statistics and a prior network of sources, targets, and signed weights. The source may be a pathway or transcription factor; the targets form the transcriptional footprint used to infer its activity.
Every input also carries a namespace and version. Ensembl IDs, Entrez IDs, and gene symbols do not map perfectly, while pathway memberships and graph edges change between releases. Mapping coverage is analysis data, not housekeeping.
| Input | Main question | Method family | Typical output |
|---|---|---|---|
| Selected genes + universe | Is membership unusually common? | ORA | overlap, odds, P value, FDR |
| Complete ranked genes | Are members shifted in the ranking? | GSEA or rank test | score, direction, FDR, drivers |
| Signed pathway graph | Does measured change propagate through the wiring? | SPIA-style topology | perturbation, FDR, coverage, predicted direction |
| Weighted regulator targets | Does the prior footprint fit observed gene movement? | decoupleR-style activity | activity, P value, FDR, coverage, footprint |
What is over-representation analysis?
Over-representation analysis asks whether a pathway contributes more genes to a selected list than expected from its representation in the tested universe. Fisher’s exact or hypergeometric tests are common choices.
Imagine 1,000 genes were testable, 100 entered the selected list, and 40 belonged to a pathway. If 15 pathway members entered the list, ORA compares that overlap with the overlap expected when selecting 100 genes from the same universe.
The null concerns membership, not coordinated direction. A pathway may be overrepresented because it contains upregulated genes, downregulated genes, or both unless the lists were separated before testing.
ORA is sensitive to the selection rule. Moving the gene-level FDR or fold-change cutoff can move genes across the boundary and change the result even when their underlying statistics barely change.
The universe is equally important. It should normally contain genes that were measurable and eligible for selection, not every gene in the genome. Identifier mapping losses and pathway database versions must travel with the result.
For executable R and Python workflows, use the dedicated GSEA and ORA pathway enrichment tutorial or the clusterProfiler ORA versus GSEA guide. This article keeps the focus on choosing and interpreting the method family.
What is ranked gene-set analysis?
Ranked gene-set analysis asks whether pathway members concentrate toward one end of a complete ordered gene list. It preserves information that a hard differentially expressed gene cutoff discards.
The original Gene Set Enrichment Analysis paper introduced a running-sum statistic over a ranked list. Its leading edge identifies the members encountered before the enrichment score reaches its strongest deviation.
The official GSEA guide distinguishes the enrichment score, normalized enrichment score, nominal P value, FDR, and leading-edge subset. These fields answer different questions and should not be reduced to “the pathway went up.”
Other rank-based tests compare the ranks of genes inside a set with genes outside it. Competitive tests must handle gene correlation carefully because pathway members often move together even under the null.
CAMERA estimates inter-gene correlation and adjusts the set statistic with a variance inflation factor. This guards against treating correlated members as if they were independent repetitions of the same signal.
Direction still refers to the ranking. Say positively enriched, negatively enriched, up-skewed, or down-skewed. Do not call a membership-based or rank-based result “activated” unless a separate mechanistic model supports that language.
A ranked score is not a pathway state
A positive enrichment score means members accumulate toward the positive end of the chosen gene ranking. It does not by itself show that signaling flux increased, every member rose, or the pathway caused the phenotype.
What is topology-based pathway analysis?
Topology-based analysis propagates measured changes through signed, directed pathway wiring. It asks whether the location and direction of changed genes perturb the graph more than expected.
Two pathways with the same changed-gene overlap can receive different topology evidence. A changed upstream hub with many signed downstream edges is not equivalent to a changed peripheral node in a set-only representation.
Signaling Pathway Impact Analysis combines classical enrichment evidence with perturbation evidence derived from pathway structure. Its bootstrap procedure assesses how unusual the observed perturbation is.
Topology results need explicit coverage and status. A pathway may lack an exact graph, have too few measured nodes, lack usable edge signs, or fail a convergence check. These states mean “not evaluable,” not “zero impact.”
Predicted activated or inhibited language can be appropriate when a signed propagation model supports it. The report should name the engine, graph source and version, mapping coverage, thresholds, uncertainty, and direction rule.
What is pathway activity inference?
Pathway activity inference estimates a regulator from the behavior of its weighted target genes. It tests whether the observed transcriptional footprint matches a prior model of activating and repressing targets.
In a simple univariate linear model, observed gene statistics are the response and signed target weights are the predictor. The fitted slope or its test statistic summarizes agreement between the prior footprint and the data.
decoupleR provides a framework for inferring biological activities with multiple methods. PROGENy supplies pathway-responsive genes and weights learned from perturbation experiments.
Coverage is part of the result because a source supported by very few measured targets is fragile. A footprint plot should expose target weights, observed movement, the fitted relationship, and influential targets instead of showing only a ranked score.
Activity remains model-based evidence. It does not directly measure protein phosphorylation, metabolite flux, receptor binding, or causal control. A strong fit says the transcriptome resembles the prior response pattern under the fitted model.
What outputs should pathway analysis report?
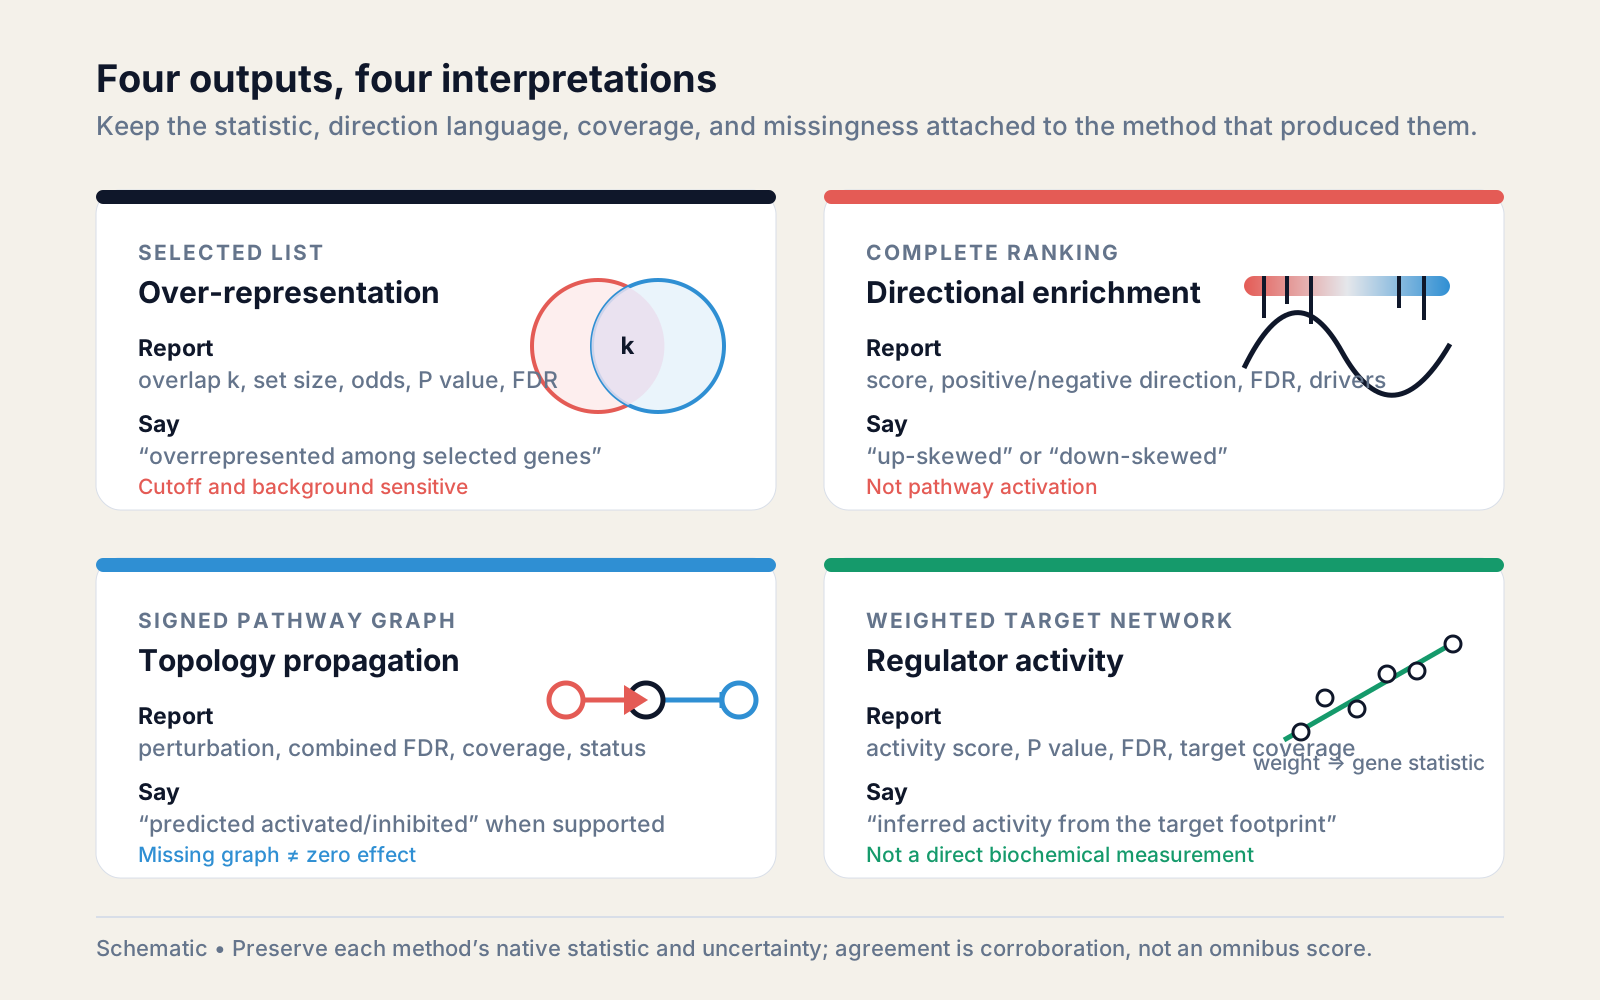
A pathway result should report the tested contrast, gene universe, identifiers, pathway source and version, method, effect or score, uncertainty, FDR, coverage, and the genes or edges driving the signal.
Start with the comparison. “Treatment versus control” needs an explicit reference direction because every signed gene statistic and pathway direction inherits that choice.
Next report the data contract. Record how many genes entered the universe, ranking, graph, or target model; how identifiers were normalized; how duplicates were handled; and how many pathway members were measured.
Then keep effect and significance separate. A large score with a weak FDR may be uncertain. A small score with a low FDR may be precise but biologically modest. FDR controls multiplicity under the method; it is not an effect size.
Finally expose drivers and provenance. Leading-edge genes, overlap genes, high-perturbation nodes, or influential weighted targets let readers test whether a pathway-level summary is broad and coherent or dominated by a few features.
Missingness needs an explicit vocabulary. Distinguish not tested, not supported by the resource, below coverage, failed, not significant, and measured near zero. Encoding every unavailable result as zero creates false agreement across methods and datasets.
How does NotchBio combine pathway evidence?
NotchBio presents enrichment, topology, and regulator activity as coordinated but separate evidence layers. It does not convert their native statistics into one universal pathway score.
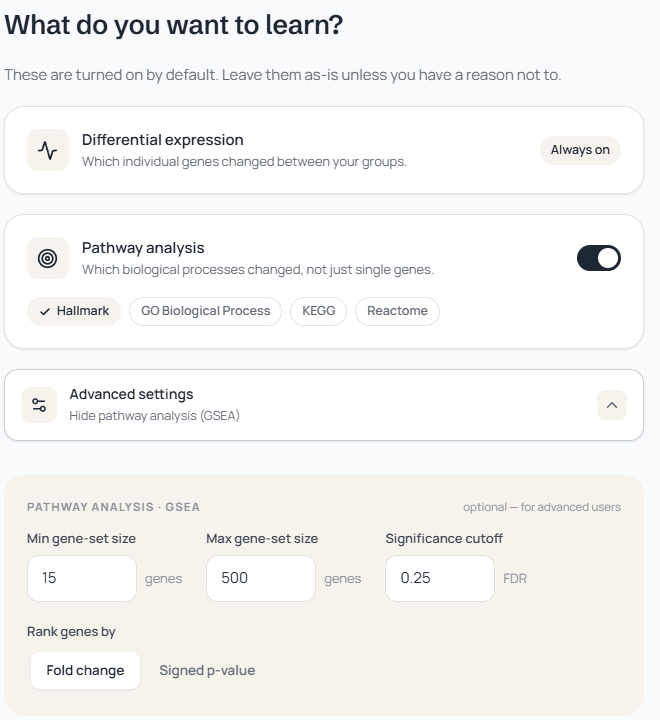
At run setup, the pathway controls expose gene-set collections, minimum and maximum set sizes, an FDR cutoff, and a ranking metric. The pipeline GSEA job uses DESeq2 output to build a ranked list and runs fgsea against selected MSigDB collections.
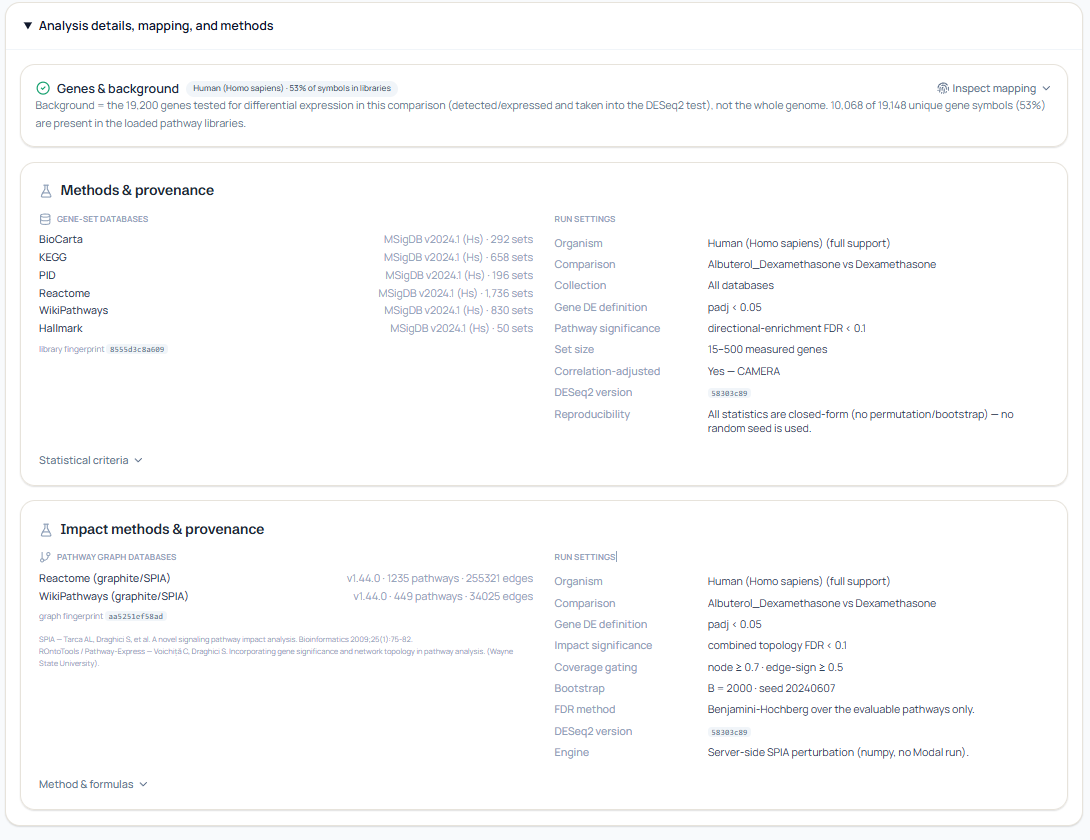
The Results Pathways workspace adds a server-side directional rank-sum view with a CAMERA-style correlation adjustment. Its code loads measured differential-expression statistics, intersects them with pinned gene sets, computes pathway-level FDR, and retains gene-level drivers.
Topology is computed separately with a pure-Python SPIA-style engine over pinned signed graphs. Coverage gates preserve not-evaluable reasons, while a deploy-time ROntoTools/SPIA provider offers a corroborating reference path.
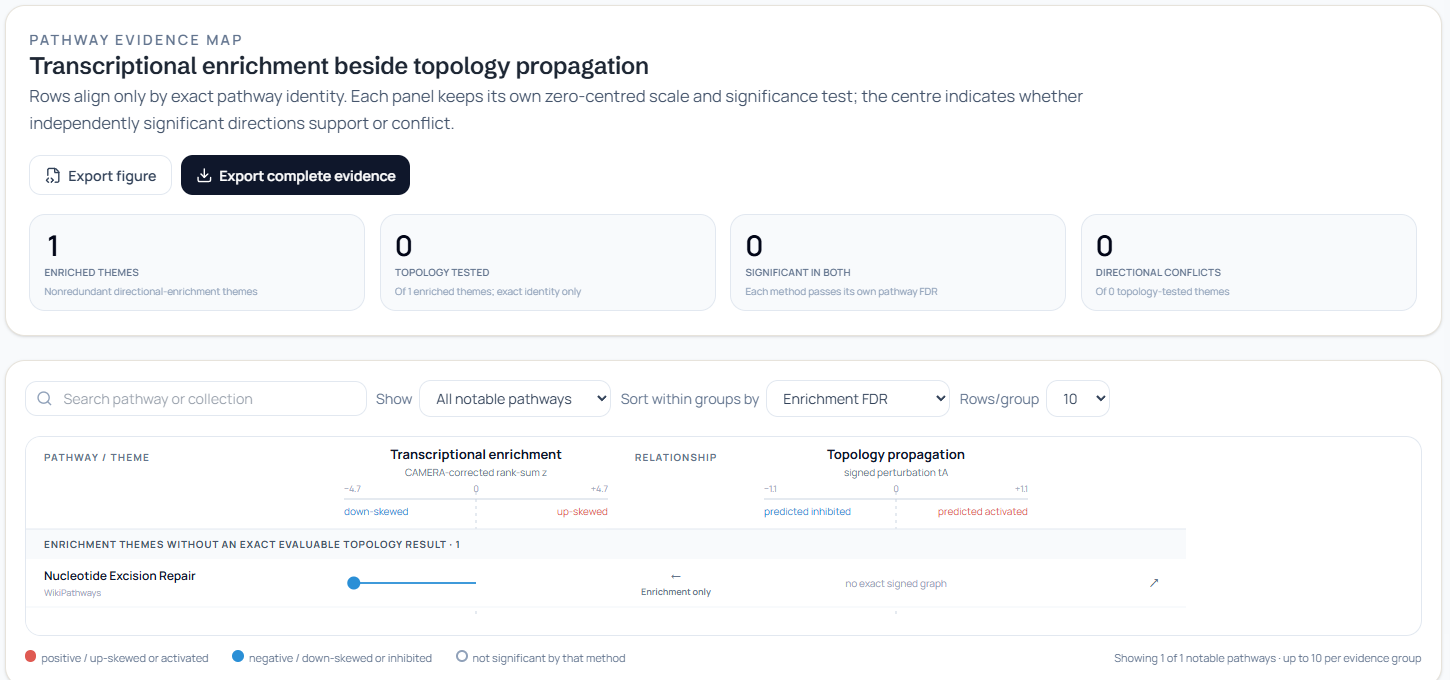
The interface aligns enrichment and topology only when pathway identity matches exactly. It keeps separate zero-centered axes, separate FDR values, explicit enrichment-only or topology-only rows, and pending or unavailable topology states.
Regulator activity is another separate workspace. NotchBio fits a decoupleR-style univariate model to a pinned weighted network, filters sources by measured-target coverage, reports a score with P value and FDR, and exposes the target footprint used to re-check the fit.
The public pathway and regulator results documentation explains the user flow. The key design principle is consistency of scope without statistical conflation: one contrast and library context can coordinate views while each method keeps its own evidence contract.
What can pathway analysis not prove?
Pathway analysis cannot by itself prove causality, biochemical activation, direct regulation, pathway flux, or clinical relevance. It produces model-dependent evidence and hypotheses.
A significant pathway may reflect shared genes with another pathway, database redundancy, cell-composition shifts, an unmodeled batch, or a small group of influential genes. Inspect drivers, sample-level patterns, and alternative annotations before assigning a mechanism.
A nonsignificant pathway is not proof of absence. Power may be limited by replication, weak gene-level precision, poor identifier mapping, an unsuitable pathway boundary, missing topology, or insufficient target coverage.
Agreement across methods can strengthen a hypothesis because independent representations support a compatible direction. It is still corroboration across models, not causal validation. Disagreement is often informative because it reveals which assumption changes the conclusion.
Report the result with calibrated language: enriched, up-skewed, down-skewed, predicted activated, predicted inhibited, or inferred activity. Attach the method to the verb so the reader can tell what was actually tested.
How do you start pathway analysis with RNA-seq data?
Start with a valid RNA-seq design and explicit contrast. Then define the gene universe and ranking, choose versioned resources, and match each method to its required input.
The next guide, How to Do Pathway Analysis with RNA-Seq, turns these choices into an end-to-end workflow. Until then, the shortest rule is reliable: choose the method from the input and question, then interpret only the statistic it actually produced.
Further reading
Read another related post
How to Build a Decoy-Aware Salmon Index for RNA-Seq
Step-by-step Salmon tutorial: download GENCODE references, build a decoy-aware index, run salmon quant with gcBias and seqBias, and verify mapping rates.
TutorialFASTQ Quality Control: FastQC, fastp, and MultiQC Workflow
Bulk RNA-seq QC end to end: run FastQC on raw reads, trim adapters with fastp, rerun QC, and aggregate everything into one MultiQC report, with parallel runs.
TutorialHow to Download RNA-Seq FASTQ Data from GEO and SRA
Download bulk RNA-seq FASTQ files from GEO and SRA: prefetch, fasterq-dump, pysradb metadata, batch downloads, and fixes for the most common errors.