How to Do Pathway Analysis with RNA-Seq
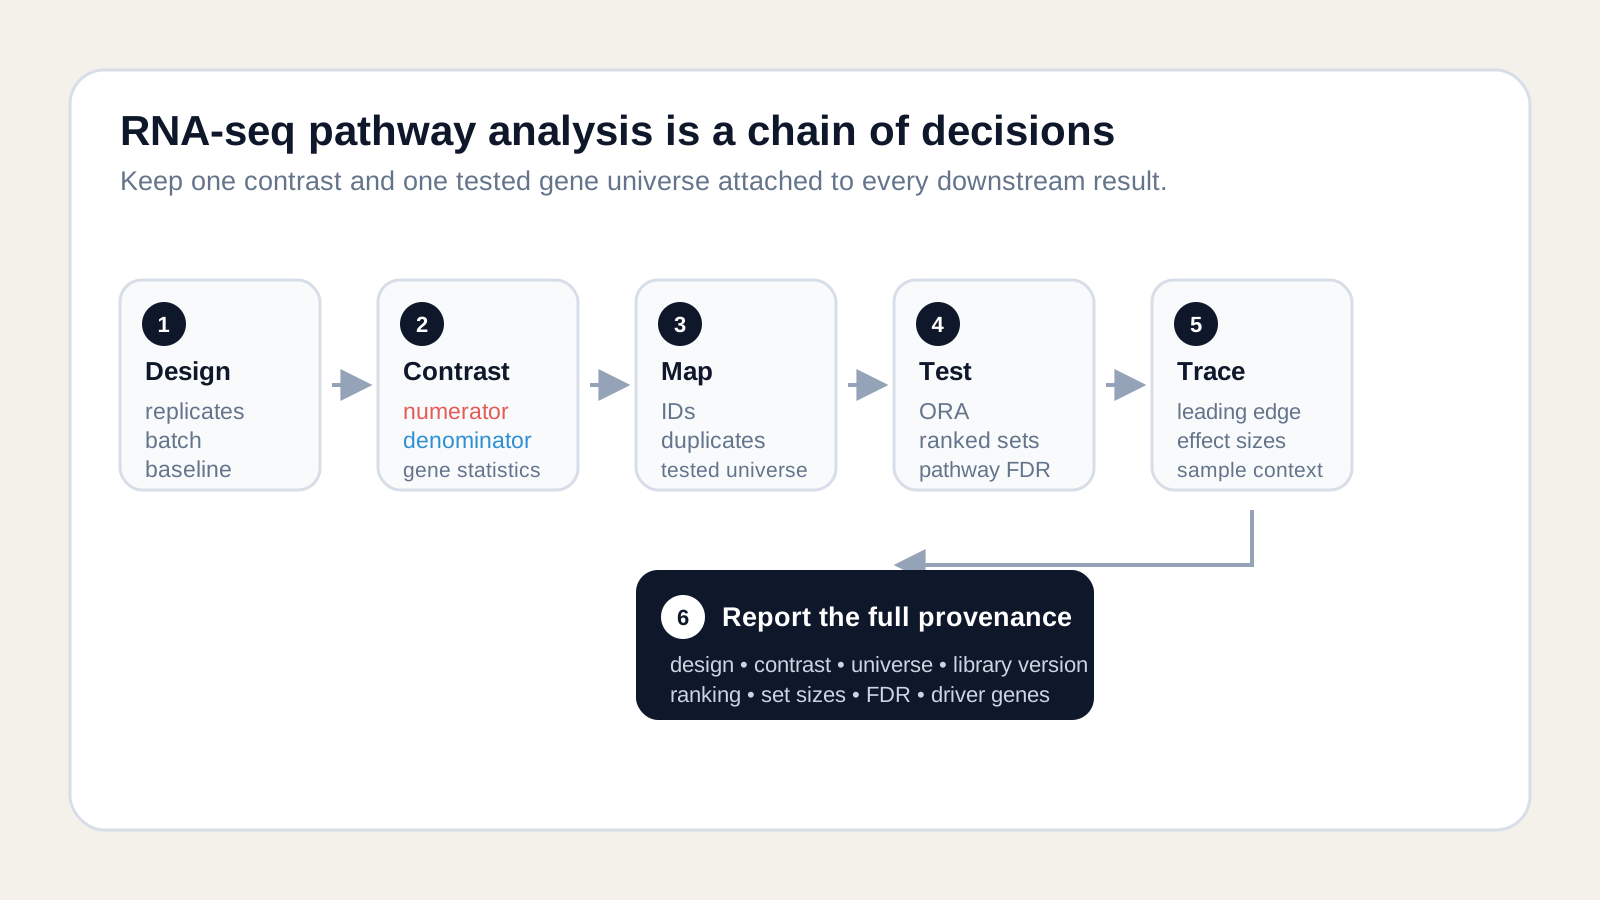
Pathway analysis with RNA-seq starts with a valid contrast, not a gene list. Fit the experiment, preserve the tested gene universe, choose a defensible ranking, test versioned gene sets, control pathway FDR, and trace every result back to genes.
That order matters. A polished pathway plot cannot repair confounded samples, a reversed contrast, lost identifiers, or an incorrect statistical background.
This guide builds the complete workflow from counts and metadata to an auditable pathway report. It focuses on the decisions around the test, while the existing ORA versus GSEA tutorial provides full package code.
What do you need before pathway analysis?
Before pathway analysis, you need replicated RNA-seq samples, trustworthy metadata, quality-controlled counts, a fitted differential-expression model, and one precise contrast.
Start with biological replicates, not repeated measurements of the same library. Two samples per group may permit a model fit, but three or more independent replicates usually provide a more stable estimate of within-group variation.
Inspect library quality, sample relationships, and known covariates before testing pathways. A batch aligned perfectly with treatment cannot be separated statistically, so every pathway result inherits that confounding.
Use PCA as a diagnostic, not a pass/fail badge. Ask whether samples separate by the intended factor, whether one sample dominates a component, and whether technical variables explain structure that the design omitted.
Low-count filtering also belongs upstream. It can improve testing efficiency, but the rule must be independent of the pathway labels and applied before defining the tested universe.
The count matrix must also match the sample table exactly. Sample names, organism, gene annotation release, strandedness, and quantification method belong in the analysis record because each can change which genes are tested.
The DESeq2 paper models RNA-seq counts with negative-binomial generalized linear models. Its current Bioconductor vignette is the primary reference for designs and contrasts.
How should the RNA-seq design define contrasts?
The design formula defines sources of variation; a contrast defines the exact numerator and denominator interpreted downstream. Write both in plain language before generating any ranked list.
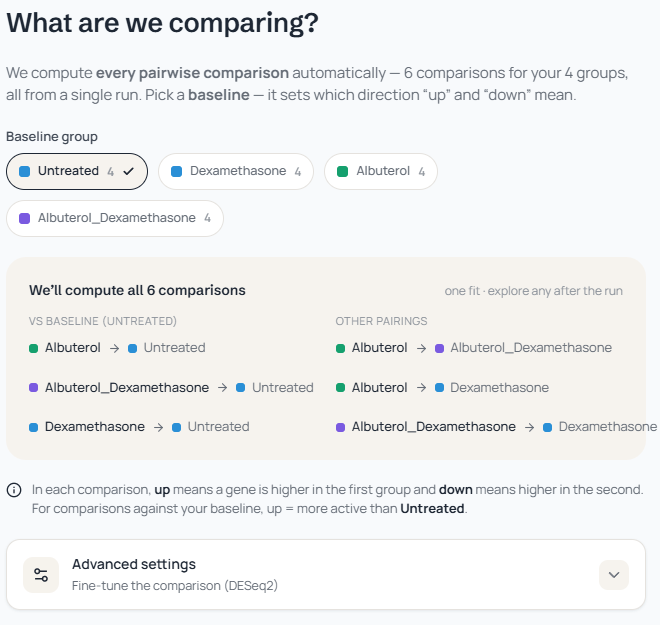
Consider four groups: untreated, drug A, drug B, and the combination. A single model can estimate the group effect and provide planned pairwise contrasts, provided the design and replication support those comparisons.
For “drug A versus untreated,” positive log2 fold change means higher expression in drug A. Reversing the contrast reverses every gene direction and every directional pathway score, even though p-values may remain similar.
Name result files with both levels, not only “comparison 1.” A durable identifier such as drugA_vs_untreated prevents a later plot, table, or notebook from losing its denominator.
Keep one contrast fixed while reviewing its volcano plot, pathway table, barcode, and driver genes. Switching comparisons mid-story creates a biologically incoherent report.
Blocking variables such as batch can enter an additive formula, for example ~ batch + group. They adjust the group estimate when the design is identifiable; they do not rescue a batch that contains only one condition.
In the four-group example, derive all planned pairwise contrasts from the same fitted model, then analyze each contrast separately. Do not pool their rankings or leading edges into one synthetic pathway score.
For factorial questions, an interaction term may be necessary. Comparing treatment effects side by side is descriptive; testing whether the effects differ requires an interaction coefficient, as explained in the DESeq2 multi-condition guide.
Which genes belong in the background?
The RNA-seq background is the set of genes that could have entered the tested result for that contrast. It is not every gene in the genome and not only the genes called significant.
For over-representation analysis, the query is the selected DEG list and the universe is all eligible tested genes after expression and quality filters. A genome-wide background can exaggerate enrichment because many annotated genes had no chance of selection.
For a ranked-set test, the input is usually one finite statistic for every eligible gene. There is no separate “significant background” because position across the complete ranking carries the information.
Identifier mapping changes both objects. Record the input ID type, target ID type, annotation version, unmapped fraction, duplicates, and the rule used when several input rows map to one symbol.
Mapping coverage should be reported as a number, not a vague assurance. If 12,000 unique tested symbols enter the analysis and 9,600 occur in the selected library, the measured coverage is 80%; the remaining genes cannot support any set from that library.
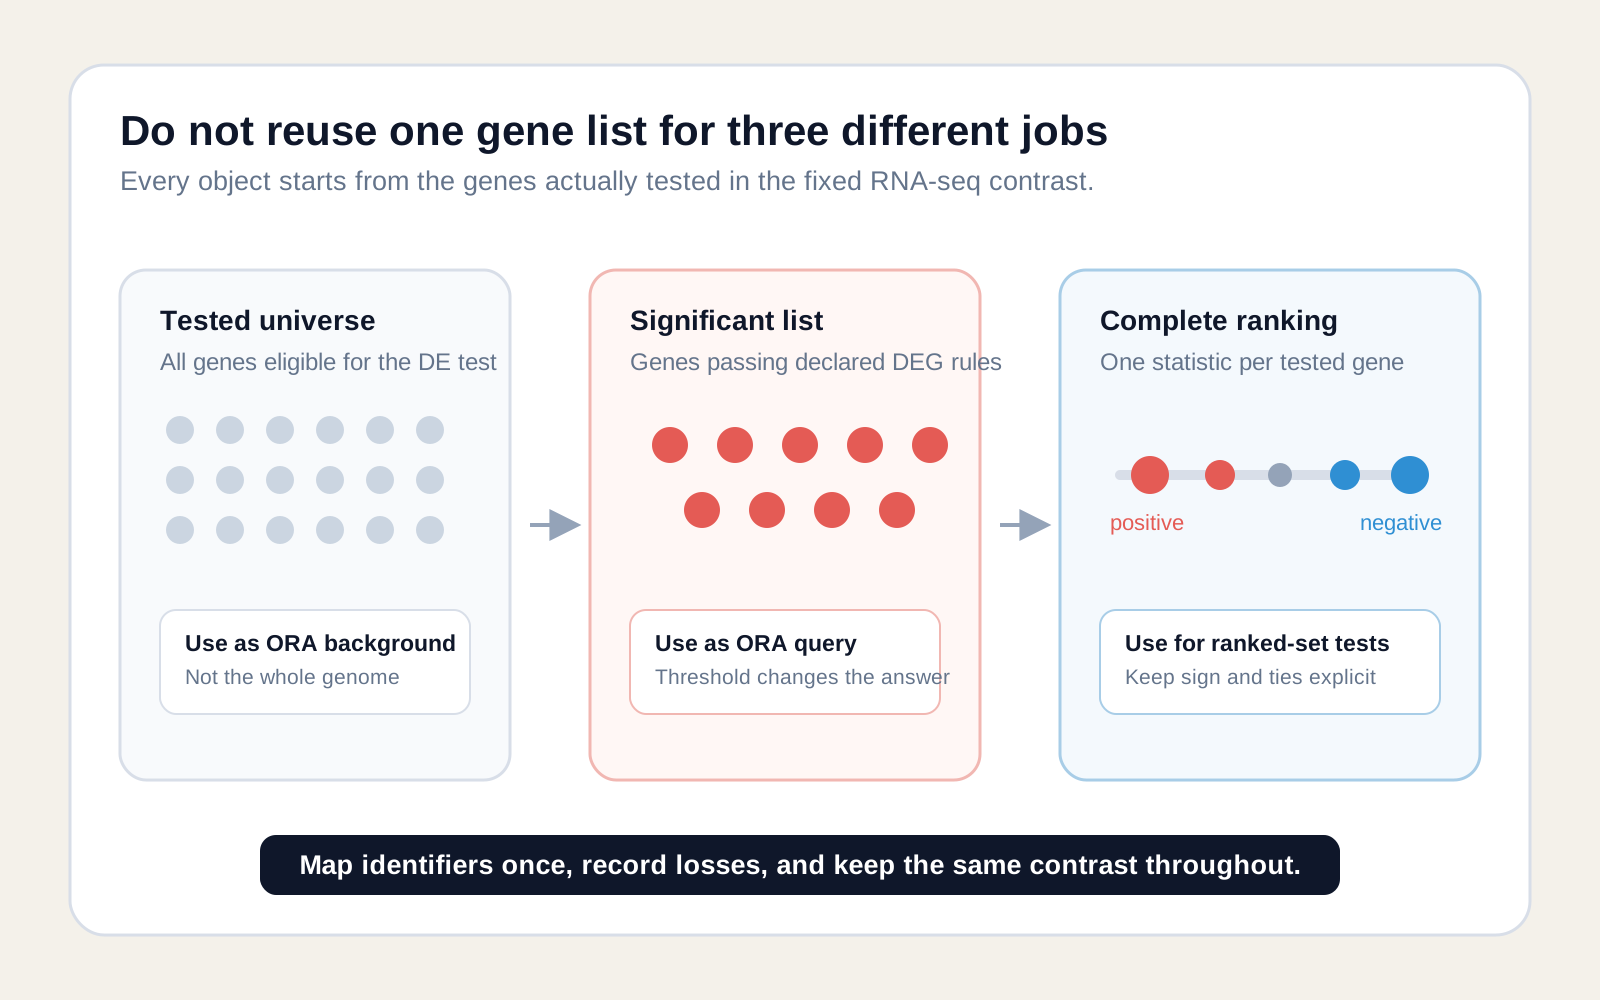
This compact synthetic Python example makes the three contracts explicit before any pathway package runs:
def read_gmt(text: str) -> dict[str, set[str]]:    pathways: dict[str, set[str]] = {}    for line in text.splitlines():        name, _description, *genes = line.rstrip().split("\t")        pathways[name] = {gene.upper() for gene in genes if gene}    return pathways
# Synthetic DE table: one row per tested gene for one fixed contrast.de = [    {"symbol": "IL6", "stat": 4.8, "padj": 0.004},    {"symbol": "STAT3", "stat": 3.1, "padj": 0.021},    {"symbol": "SOCS3", "stat": 2.4, "padj": 0.08},    {"symbol": "CXCL8", "stat": -2.9, "padj": 0.03},    {"symbol": "GAPDH", "stat": 0.1, "padj": 0.92},]
by_symbol: dict[str, dict] = {}for row in de:    symbol = row["symbol"].upper().strip()    if not symbol:        continue    if symbol in by_symbol:        raise ValueError(f"Duplicate symbol needs a declared rule: {symbol}")    by_symbol[symbol] = {**row, "symbol": symbol}
tested = list(by_symbol.values())
universe = {row["symbol"] for row in tested}significant = {row["symbol"] for row in tested if row["padj"] < 0.05}ranking = sorted(    ((row["symbol"], row["stat"]) for row in tested),    key=lambda item: item[1],    reverse=True,)
gmt = "INFLAMMATORY_SIGNALING\tcurated\tIL6\tSTAT3\tSOCS3\tCXCL8\n"pathways = {    name: members & universe    for name, members in read_gmt(gmt).items()}
assert len(universe) == 5assert significant == {"IL6", "STAT3", "CXCL8"}assert ranking[0] == ("IL6", 4.8)assert pathways["INFLAMMATORY_SIGNALING"] <= universe
The example refuses duplicate symbols instead of resolving them silently. Highest mean expression, strongest absolute statistic, or a documented aggregation may be defensible, but the rule must be chosen before testing pathways.
Intersect every pathway with the tested universe before applying set-size filters. A database pathway containing 300 genes may have only 11 measured genes, so its effective size and statistical stability belong to this experiment.
Should you use a DEG list or a ranked list?
Use a DEG list for ORA when the selected genes define a meaningful decision set. Use a complete ranking for GSEA-like methods when coordinated modest shifts matter and a hard cutoff would discard useful information.
ORA asks whether selected genes overlap a pathway more than expected relative to the tested universe. Its answer depends on the DEG threshold, effect-size rule, and universe.
Ranked-set analysis asks whether pathway members concentrate toward one end of an ordered gene list. It preserves genes below the DEG cutoff, but its answer depends on the ranking statistic and handling of ties.
The DESeq2 Wald statistic combines direction with uncertainty and is often a strong ranking choice. Log2 fold change is easier to explain, while signed p-value rankings can overemphasize tiny but precise effects.
No ranking is universally correct. Declare it before looking at pathway names, inspect its distribution, remove non-finite values, resolve duplicate IDs, and keep the sign convention attached to the contrast.
Inspect ties near zero and extreme values. Thousands of identical ranks weaken ordering information, while one huge statistic can dominate a weighted running sum. If a statistic is capped or transformed, record that transformation.
Run a simple sensitivity check with a second justified ranking only when it was planned. Concordant drivers strengthen confidence; disagreement should trigger inspection of effects and uncertainty, not selective reporting.
Run both only when they answer planned questions
ORA and ranked-set analysis are complementary, not a contest for the smallest FDR. Report their inputs and null hypotheses separately, then investigate agreement or disagreement through the contributing genes.
How do you choose pathway databases?
Choose a database for its biological scope, organism, identifier system, version, and curation model. Running every available collection at once increases redundancy and the number of tested hypotheses.
MSigDB documents nine major human collections. Hallmark offers a compact view of coherent states, while C2 includes curated resources such as Reactome and WikiPathways. GO collections describe structured biological annotations rather than only signaling routes.
Start with the collection that matches the question. A metabolism study may need curated reaction pathways; a broad perturbation screen may start with Hallmark; a mechanistic follow-up may use a focused Reactome subset.
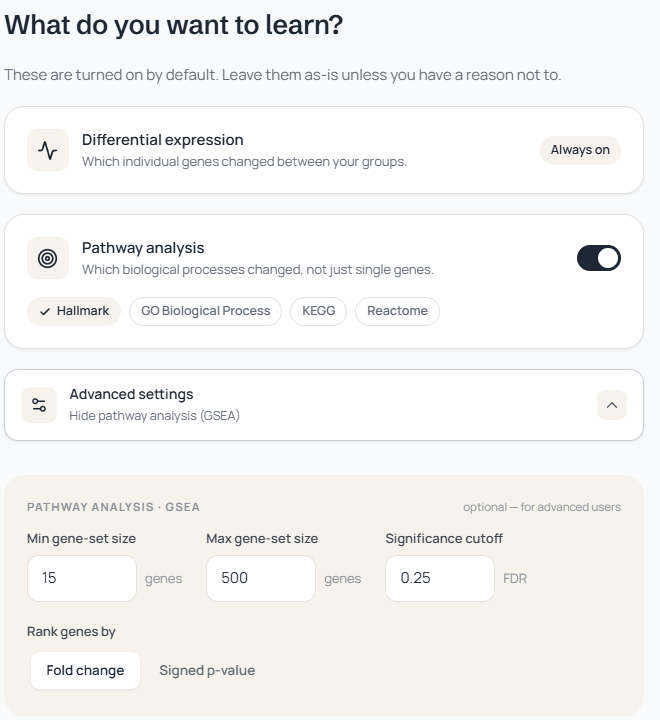
Gene-set size filters remove sets too small for stable inference and sets so broad that interpretation becomes vague. The GSEA user guide exposes minimum and maximum size controls because measured overlap, not database size alone, determines the effective set.
Record the release and species. A human-symbol library applied to another organism without an audited ortholog mapping can produce plausible labels from partial symbol overlap while losing much of the biology.
Avoid mixing collections with different semantic granularity without labeling them. A broad GO process and a narrow curated signaling route can overlap heavily yet answer different questions.
How do you control pathway-level FDR?
Adjust p-values across the pathways tested in the declared analysis family, then report adjusted values with effect direction and method. A nominal pathway p-value is not enough.
Testing hundreds or thousands of overlapping pathways creates many opportunities for small p-values by chance. Benjamini-Hochberg FDR controls the expected proportion of false discoveries among rejected hypotheses under its assumptions.
The 2022 Nine quick tips for pathway enrichment analysis recommends corrected rather than nominal p-values and emphasizes that input quality, database choice, and method choice must be planned before interpretation.
State whether correction occurred within each collection or across a merged library. Neither choice is automatically wrong, but it changes the family of claims and therefore the adjusted values.
An FDR threshold is a reporting rule, not a biological boundary. Preserve the complete result table so readers can distinguish a weak, directional pattern from a pathway that was never tested or failed mapping.
Avoid ranking only by FDR. Show an effect-like score, direction, measured set size, and coverage beside uncertainty. A tiny q-value can accompany a small effect, while a large set may dominate an unnormalized statistic.
If no pathway passes the threshold, report that result. Do not relax FDR, change databases, or alter the ranking until a familiar pathway appears; any sensitivity analysis must remain visibly exploratory.
How do you trace a pathway back to genes?
Trace every pathway result to its measured members, leading edge or overlap, gene-level effects, and sample context. The pathway label is a summary, not the evidence itself.
For ORA, inspect which selected genes overlap the set and how they compare with the universe. For GSEA, inspect the leading-edge subset that drives the running enrichment score.
Check whether drivers move coherently, whether one extreme gene dominates, and whether those genes are well measured. Individual driver genes need not pass gene-level FDR for a coordinated set-level shift to be informative.
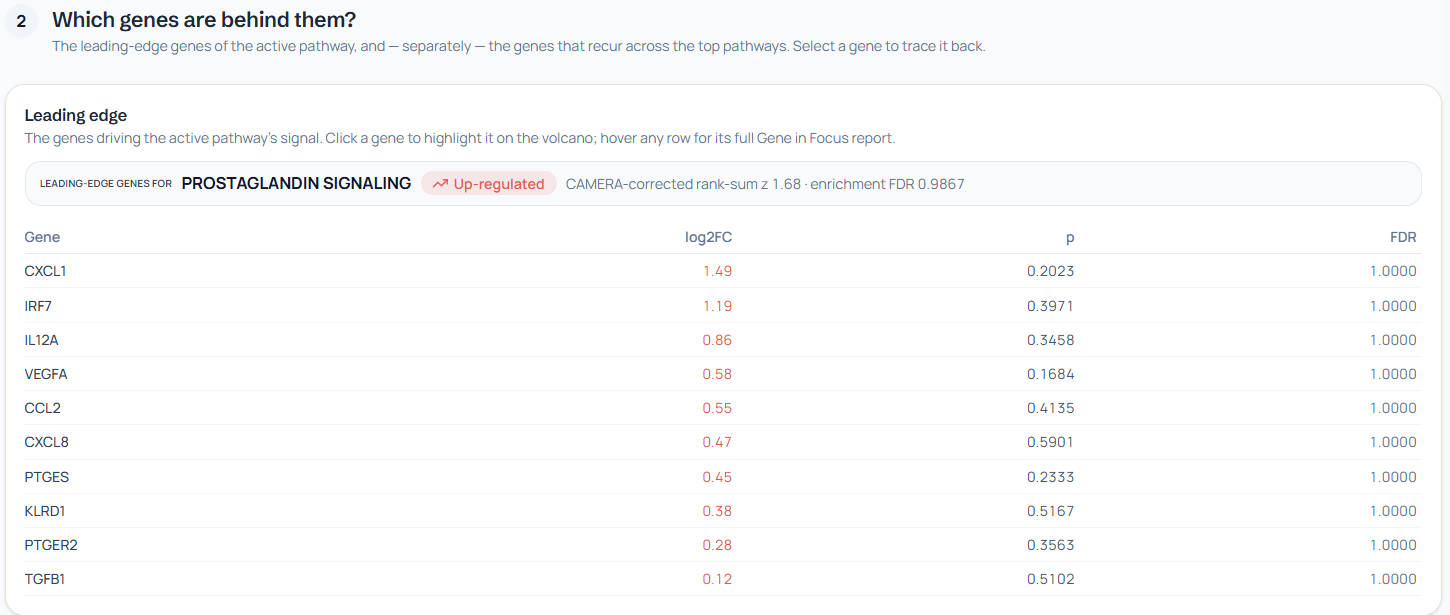
Return to normalized expression and sample-level plots when a driver looks suspicious. An outlier, annotation ambiguity, or low-count estimate can produce a striking gene statistic without a stable group pattern.
Pathway redundancy also matters. Two significant labels may share most of their drivers, so they are not two independent biological discoveries. Report shared genes or collapse redundant terms while retaining the original table.
Compare driver direction with the pathway label. A pathway containing both activators and inhibitors cannot be interpreted mechanistically from member expression alone, because gene-set membership usually omits signed causal wiring.
How should you report the workflow?
Report enough information to reconstruct the exact gene universe, ranking, library, test, correction, and driver-gene interpretation for each contrast. A pathway plot without provenance is not reproducible.
At minimum, record the organism, genome and annotation release, quantification method, count filtering, design formula, contrast direction, DE software version, and gene identifier type.
For the pathway step, record the selected-gene rule, tested universe, ranking formula, tie handling, database name and release, effective set-size window, mapping coverage, method version, permutation settings, and FDR family.
| Report layer | Required fields | Why it matters |
|---|---|---|
| Experiment | samples, groups, replicates, covariates | Defines what can be estimated |
| Contrast | numerator, denominator, model | Fixes every downstream direction |
| Genes | tested universe, ID type, mapping losses | Defines eligible evidence |
| Pathways | database, version, species, size window | Defines biological hypotheses |
| Statistics | method, ranking, permutations, FDR family | Defines the null and uncertainty |
| Interpretation | direction, drivers, coverage, limitations | Defines the claim boundary |
Export full gene and pathway tables, not only significant rows. Preserve software versions, parameter files, and the random seed when the method uses stochastic estimation.
A concise methods sentence should still identify the decisive choices. For example: “Genes tested by DESeq2 for drug A versus untreated were ranked by Wald statistic and tested against MSigDB Hallmark release X with measured set sizes from 15 to 500; pathway p-values used BH correction.”
Pair that sentence with a machine-readable manifest. Human prose explains intent, while a JSON, YAML, or tabular record prevents thresholds and versions from being lost during figure revisions.
How does NotchBio run the same sequence?
NotchBio connects run design, DESeq2 contrasts, run-time fgsea, and a separate Results pathway workspace while keeping their methods and provenance distinct. The code does not treat all pathway views as one score.
The shared run configuration defines group, cell_line, and batch, builds additive formulas, and displays Hallmark, GO, KEGG, and Reactome choices. It also stores ranking metric, set-size limits, and pathway adjusted-p threshold.
One current code boundary needs to stay visible. The wizard sends narrow C2:CP:KEGG and C2:CP:REACTOME codes, while the run-time executor branches only on H, C2, and C5. Until those codes are normalized, do not claim that the two narrow chips select distinct run-time subcollections; verify the saved manifest and output.
The backend fits one DESeq2 model and writes per-comparison gene statistics. Its fgsea step ranks by log2 fold change or signed p-value, filters measured gene-set size, computes adjusted values, and exports leading-edge members.
Another current boundary is contrast coverage. The run-time fgsea launcher consumes the legacy deseq2_results.csv, which DESeq2 creates from the first comparison, rather than iterating over every __results.csv file. Treat that run-time pathway output as first-contrast output unless the implementation changes.
NotchBio defaults are starting points, not universal biological standards. A researcher remains responsible for choosing a collection, ranking, size window, and FDR rule that fit the organism and question.
The Results workspace adds a server-side directional rank-sum view with CAMERA-style correlation adjustment. It audits unique symbols, duplicate collapse, library matches, database versions, and the tested DE gene background.
That distinction is important: run-time fgsea settings should not be presented as the formula for every Results chart. The Results lollipop uses a CAMERA-corrected rank-sum, not topology propagation or a PROGENy activity score.
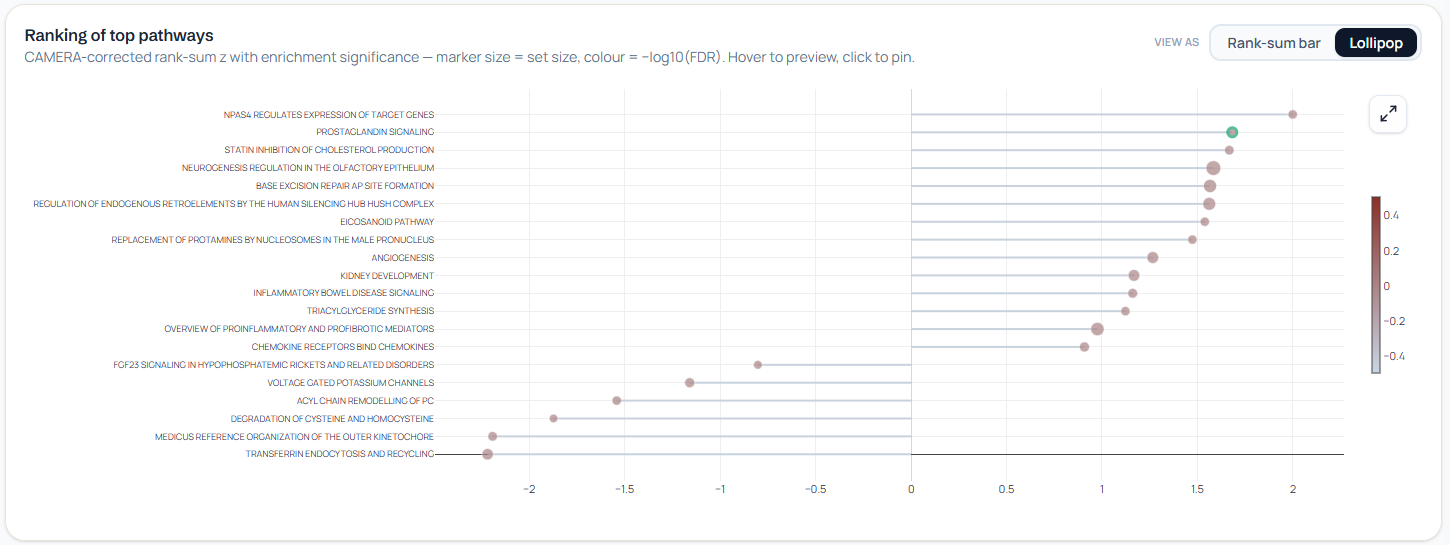
The methods drawer records mapping coverage, library provenance, thresholds, and topology availability. Missing topology remains missing rather than becoming zero, and an enrichment result alone is described as up- or down-skewed rather than activated or inhibited.
Which failure modes invalidate the result?
A pathway result is invalid when its design, contrast, universe, identifiers, statistical family, or provenance cannot support the claim. Attractive visualization does not lower that standard.
Stop before interpretation if treatment is confounded with batch, replication is absent, sample labels are uncertain, or the contrast does not match the biological question.
Rebuild the pathway inputs if many identifiers fail mapping, duplicates are handled silently, the ORA universe is the whole genome, or the ranked list contains only significant genes.
Repeat the pathway test if database versions are unknown, species do not match, set-size filters were chosen after seeing results, nominal p-values replace pathway FDR, or only favorable collections are reported.
Narrow the language if a gene-set result is called activation, member expression is called pathway activity, correlation is called regulation, or a side-by-side contrast is called an interaction.
Finally, validate the biology. Pathway analysis prioritizes coherent hypotheses; it does not prove molecular flux, protein activity, causal regulation, or therapeutic mechanism without orthogonal evidence.
The next step is to restore entities and signed edges to the rows in a pathway table. Continue with How to Build a Biological Pathway Diagram, or use the pathway enrichment guide for package-level ORA and GSEA code.
Further reading
Read another related post
RNA-Seq Plots: Volcano, MA, and Heatmap in R and Python
Publication-ready RNA-seq plots in R and Python: volcano with ggplot2/ggrepel, MA plots, and DEG heatmaps with pheatmap and seaborn, plus 300 dpi export.
BioinformaticsBulk RNA-Seq vs Single-Cell RNA-Seq: Which Should You Use?
Single-cell RNA-seq dominates conferences but bulk RNA-seq remains the right tool for most experiments. A decision framework for choosing your modality.
TutorialBulk RNA-Seq Deconvolution: CIBERSORTx and MuSiC Tutorial
Estimate cell type proportions from bulk RNA-seq using CIBERSORTx and MuSiC. Reference selection, batch correction, validation, and result interpretation.