Pathway Enrichment vs Pathway Activity
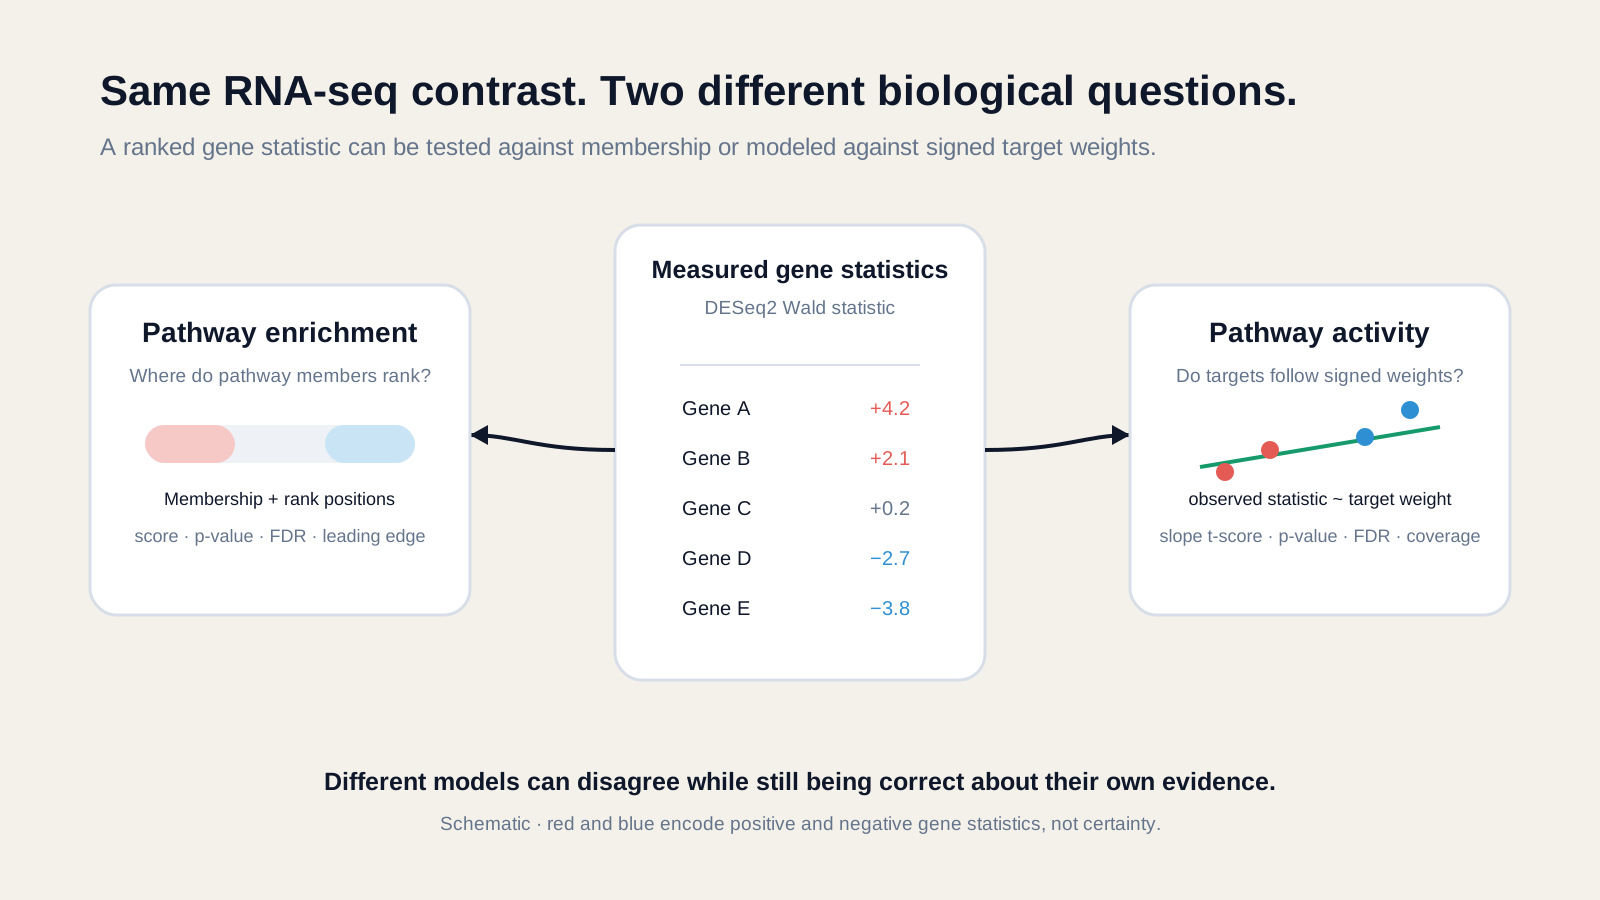
Pathway enrichment asks whether pathway genes occupy unusual positions in your data. Pathway activity asks whether measured genes follow a signed model of a pathway’s downstream response.
These questions overlap, but they are not interchangeable. A pathway can be enriched without a coherent activity footprint, or show a strong footprint even when its canonical members are not collectively shifted.
What is pathway enrichment?
Pathway enrichment tests whether genes assigned to a pathway are overrepresented in a selected list or systematically shifted within a full ranked list.
Over-representation analysis starts with a selected gene list. It compares the observed pathway overlap with the overlap expected from a defined background, often using Fisher’s exact test or a hypergeometric test.
Ranked gene-set methods start with every measured gene ordered by a statistic. GSEA follows a running sum, while other rank tests compare member and non-member positions. Both ask whether membership concentrates toward one end of the ranking.
Direction in a ranked result describes where members sit. Positive enrichment means members tend toward the positive end of the chosen statistic; negative enrichment means they tend toward the negative end.
That direction does not, by itself, establish pathway activation. An enrichment model may not know whether a member promotes the pathway, inhibits it, or is merely annotated to the same process.
If you need a full implementation guide, see Pathway Enrichment Analysis: GSEA and ORA in R and Python and What Is GSEA?.
What is pathway activity inference?
Pathway activity inference estimates a regulator’s state from the observed behavior of genes expected to respond when that regulator changes.
The model needs more than a set of names. It needs a prior-knowledge network linking each source, such as a pathway or transcription factor, to target genes. Each edge may carry a sign and a continuous weight.
A positive weight means the target is expected to rise when the source is active. A negative weight means the target is expected to fall. Larger absolute weights give a target more influence under the model.
PROGENy builds pathway footprints from genes that respond consistently across perturbation experiments. These responsive genes can differ from genes encoding the pathway’s signaling machinery.
decoupleR provides a common framework for applying prior-knowledge networks to omics data. Its methods can use interaction signs and weights that ordinary membership tests omit.
One simple method is a univariate linear model:
observed_gene_statistic = intercept + slope × target_weight + erroractivity_score = t statistic for the fitted slopeThe model asks whether genes with positive weights tend to have positive statistics and genes with negative weights tend to have negative statistics. The slope’s t-value standardizes that agreement against residual variation.
Why can enrichment and activity disagree?
Enrichment and activity disagree when pathway membership and downstream signed responses capture different genes, directions, coverage, or biological layers.
Imagine a MAPK pathway gene set dominated by receptors and kinases. Their transcripts may barely change because signaling is controlled through phosphorylation, so membership-based enrichment can be weak.
Downstream response genes may still move coherently after MAPK signaling changes. A PROGENy-style footprint can therefore produce a strong activity score even when the pathway’s structural members are not enriched.
The reverse can also occur. Stress may shift many genes annotated to a pathway, producing enrichment, while the signed response pattern expected by the activity network is inconsistent. The pathway label matches, but the evidence does not support one coherent modeled state.
Technical differences also matter. The two analyses may use different gene universes, identifier mappings, ranking metrics, pathway versions, target coverage thresholds, or multiple-testing families.
Before explaining disagreement biologically, compare these contracts:
| Question | Enrichment | Activity inference |
|---|---|---|
| What defines the pathway? | Gene-set membership | Signed, weighted source-to-target edges |
| What is the input? | Selected genes or ranked genes | Gene-level statistics or expression profiles |
| What creates direction? | Position in the ranking | Agreement with signed target weights |
| What is the main output? | Overlap or enrichment score, p-value, FDR | Model score, p-value, FDR, target coverage |
| What drives interpretation? | Members or leading-edge genes | Targets with influential weights and observed movement |
| What is the strongest claim? | Members are overrepresented or directionally shifted | Data agree with a specified activity footprint model |
How do you diagnose conflicting pathway scores?
Diagnose conflicting scores by auditing input alignment first, model coverage second, and biological explanations only after the technical contracts match.
Start with the comparison direction. If enrichment ranks treatment versus control but activity uses control versus treatment, the signs should reverse. A label mismatch can look like biological conflict.
Next, inspect identifiers and coverage. Record the number of measured genes, mapped pathway members, annotated targets, and detected targets. A pathway can have broad gene-set coverage but sparse footprint coverage because the resources contain different genes.
Then compare the input statistic. A Wald statistic combines effect size with its standard error, while log2 fold change does not. An activity score built from one and enrichment built from the other may emphasize different genes.
Check pathway identity and version. Two resources can use the same familiar label while defining different members, targets, or boundaries. Similar names are not evidence that the underlying models match.
Finally, inspect drivers rather than only scores. Review the enrichment leading edge beside the activity footprint targets. Ask whether the same genes drive both results, whether their expected signs agree, and whether one influential target dominates the fit.
Use a compact audit record for every comparison:
contrast: treatment_vs_controlgene statistic: DESeq2 Wald statenrichment resource: collection + versionactivity resource: network + versionmapped members: n / annotateddetected targets: n / annotatedmultiple testing: method + tested familyThis audit often turns “the tools disagree” into a precise explanation: the methods tested different models over different subsets of the measured data.
How do signed target weights change the score?
Signed target weights let opposite gene movements support the same source state when the prior model expects those opposite responses.
Suppose an active regulator induces genes A and B but represses genes D and E. If A and B rise while D and E fall, all four movements support positive activity even though their observed statistics have different signs.
An unweighted gene set treats those genes as equal members. It can detect a coordinated rank shift, but it cannot encode that some targets should move in the opposite direction from others.
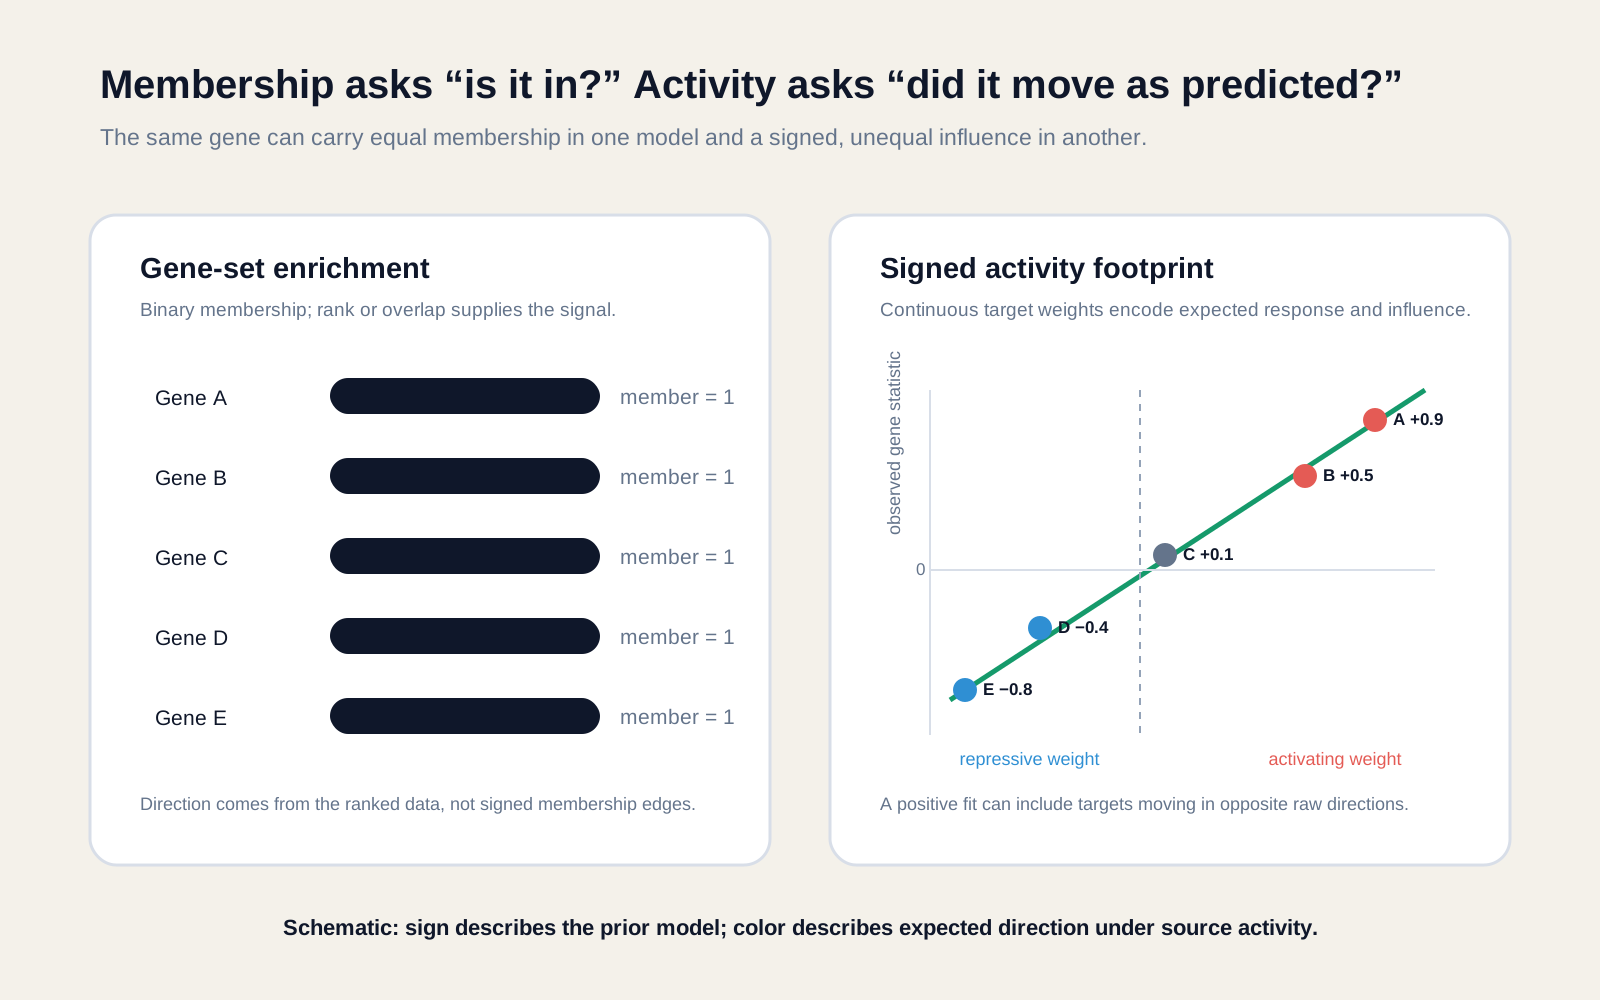
The distinction also explains why raw agreement counts are inadequate. One strongly weighted discordant target can matter more than several weakly weighted concordant targets.
In the ULM, every measured gene occupies one row. Targets receive their network weights and non-targets receive zero, so the slope is estimated against the full measured background rather than a target-only subset.
Centering the weights and observed statistics separates the slope from the intercept. The standard error then reflects residual scatter around the fitted line, and the slope divided by that standard error becomes the t-score.
A large positive t-score means the fitted positive slope is strong relative to unexplained variation. A large negative score means the observed pattern runs against the source-active expectation encoded by the weights.
The sign still belongs to this specific contrast. Reversing treatment and control reverses the gene statistics and should reverse the fitted activity direction when every other input remains unchanged.
Weights are prior assumptions, not measurements from the current experiment. If they were learned in another tissue or perturbation context, they may not reproduce every context-specific response.
For transcription factors, CollecTRI provides signed TF-to-target regulons compiled from multiple resources. Its authors also note limits from literature bias and context-general interactions.
What does an activity footprint show?
An activity footprint shows the genes that earned a regulator’s score by plotting observed movement against each target’s signed prior weight.
The plot should reveal the fitted trend, target coverage, influential targets, and discordant points. A single activity dot without this evidence is much harder to audit.
In a positive footprint, positively weighted targets tend upward and negatively weighted targets tend downward. The pattern need not be perfect because expression noise, network error, feedback, cell mixture, and context-specific regulation add residual variation.
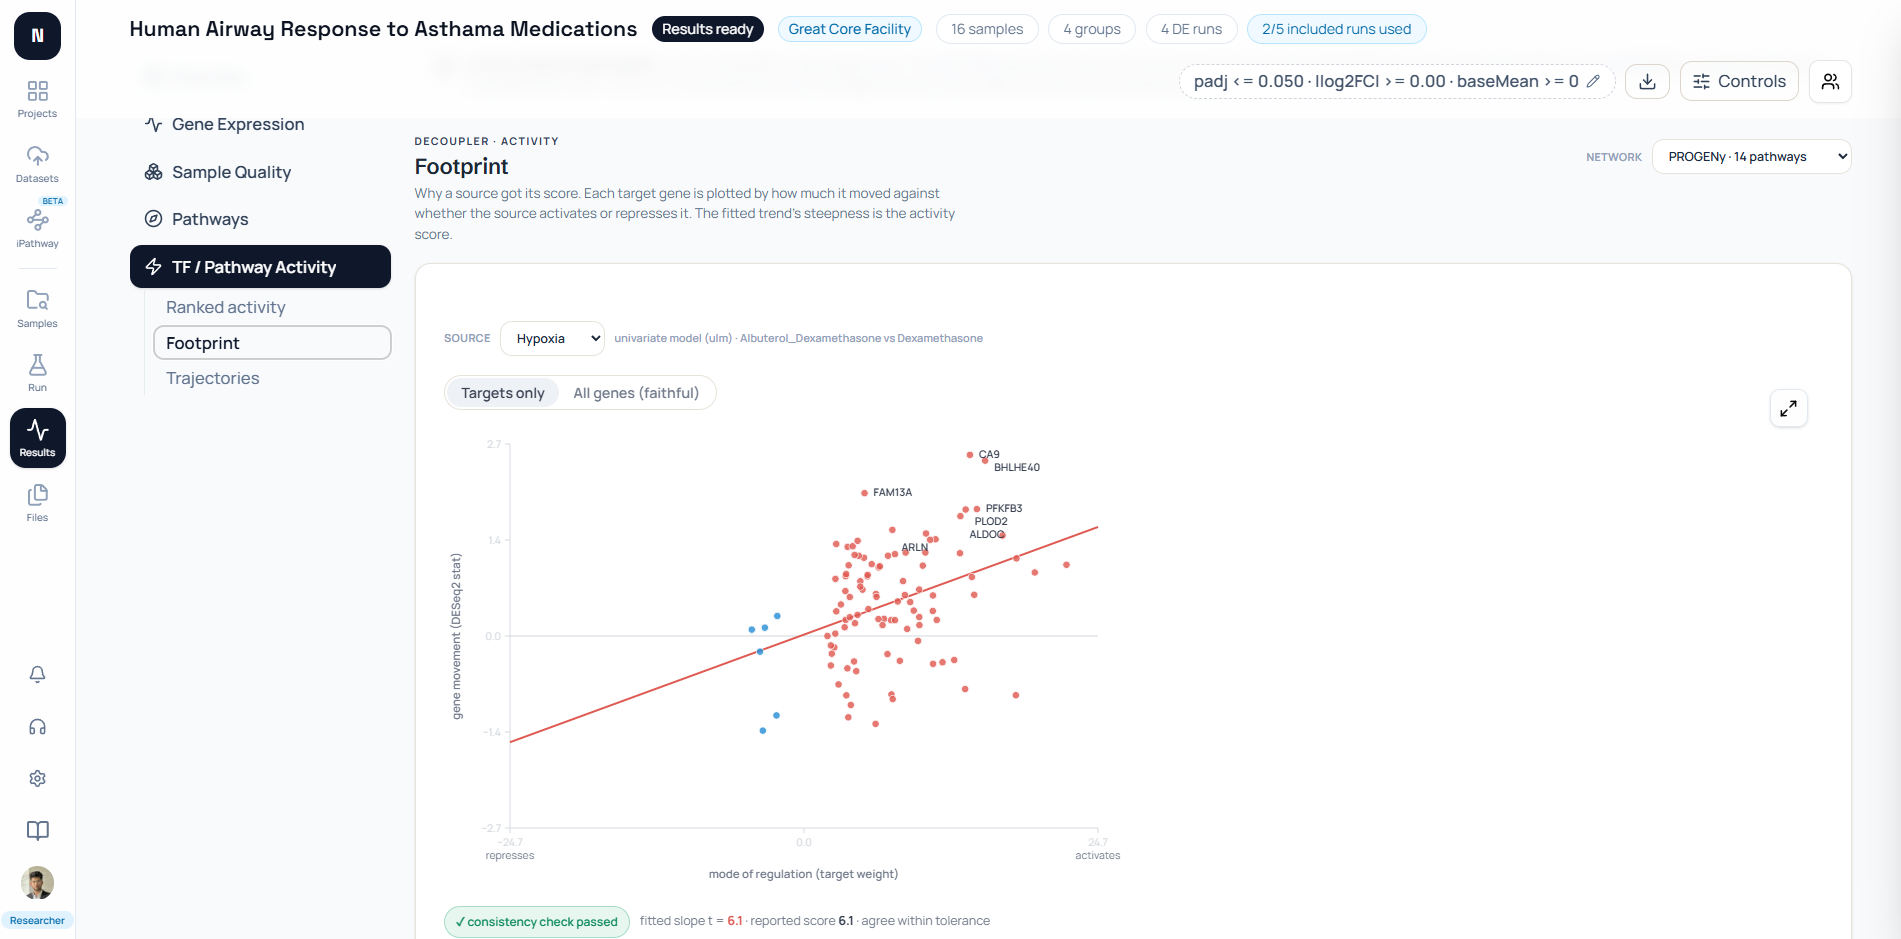
Coverage is essential. A score based on five detected targets carries less network evidence than one supported by most annotated targets, even if both pass the same minimum.
Coverage has two denominators worth reporting. Detected targets show how many edges entered the score; annotated targets show how much of the available network was observed. The ratio helps reveal whether a high score rests on a narrow slice of the footprint.
Statistical significance adds another layer. The model can produce a large-looking score with an unconvincing p-value, while testing many sources increases the FDR. Effect direction, p-value, FDR, and coverage should remain separate columns.
NotchBio sets min_n=5, matching the default in the versioned decoupler 1.9.2 run_ulm interface. Newer decoupler APIs call their set-size floor tmin. Either threshold filters sparse sources; it does not guarantee biological validity.
How should activity be compared across conditions?
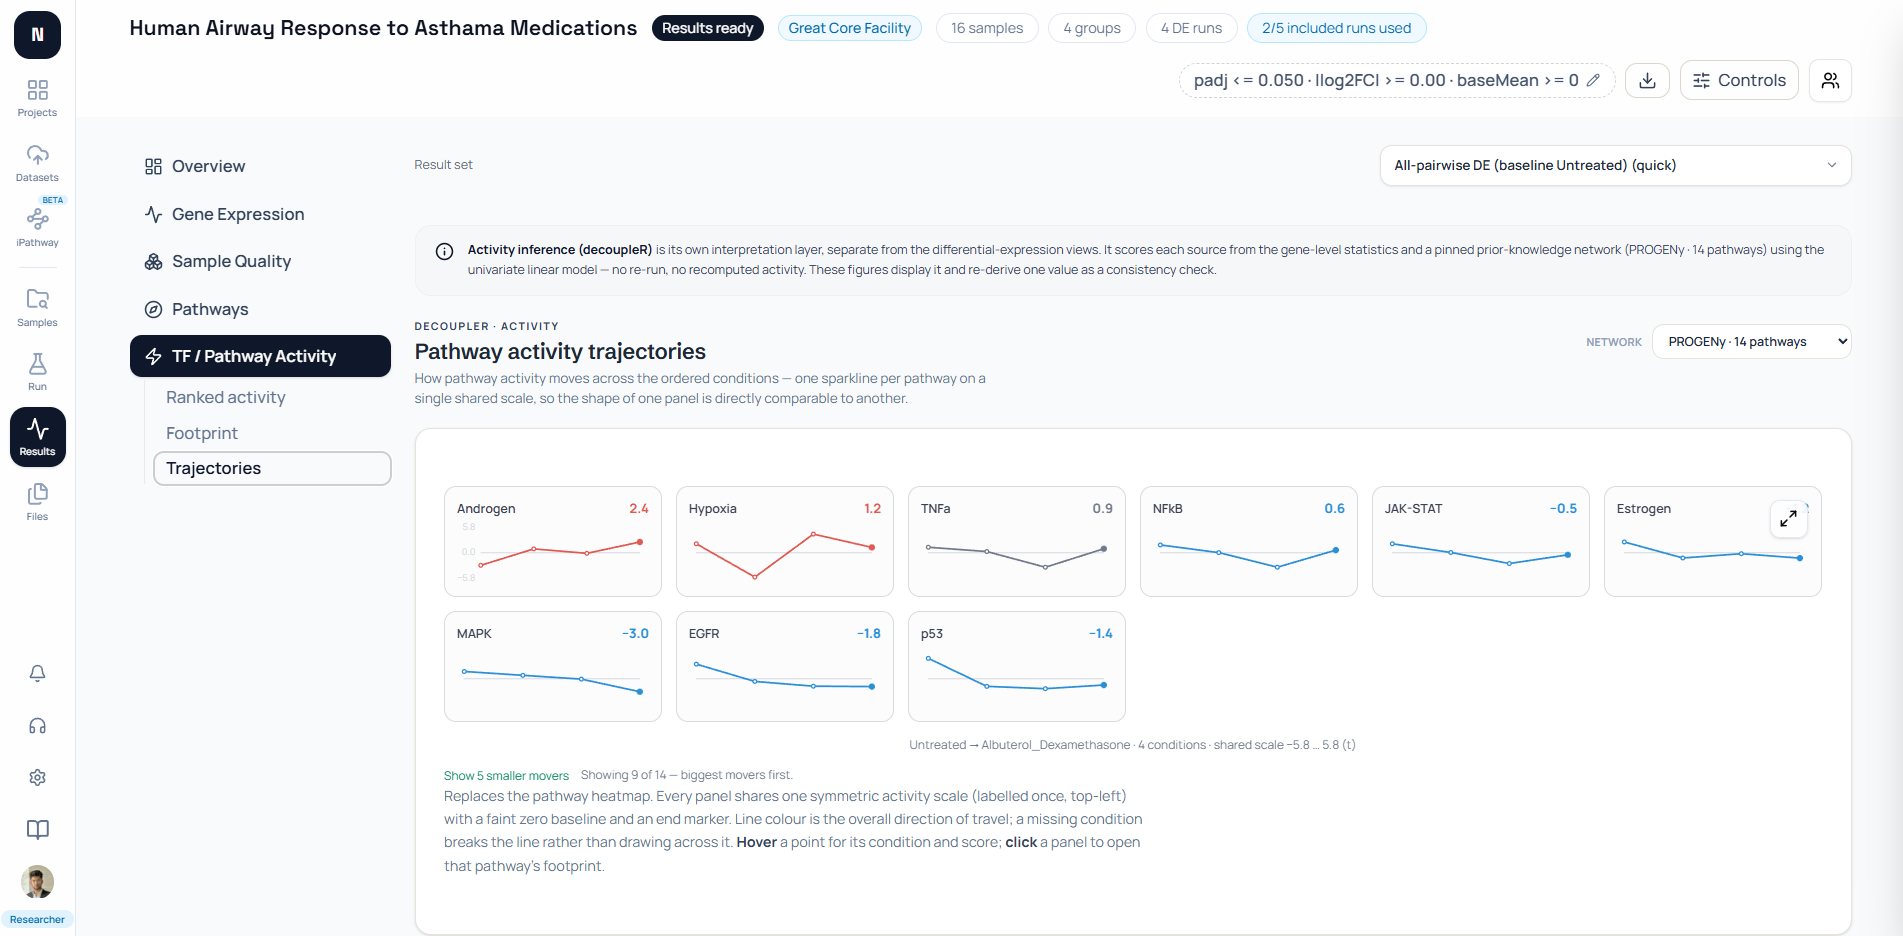
Compare pathway activity across conditions only when the scores share the same network, preprocessing, gene universe, model, and scale.
A common zero-centered scale makes polarity and magnitude visually comparable. Missing values should stay missing, because drawing a line through absent evidence creates a false trajectory.
Condition order also needs meaning. A sequence of control, drug A, drug B, and combination is an ordered comparison, not automatically a time course. A line helps trace patterns but does not manufacture temporal evidence.
For independent studies, do not compare raw scores until network versions, identifiers, preprocessing, and score calibration are harmonized. Compare complete score tables rather than only the pathways crossing an FDR threshold.
How does NotchBio separate enrichment and activity?
NotchBio keeps enrichment, topology propagation, and decoupleR-style activity as distinct evidence layers instead of collapsing them into one universal pathway score.
The Pathway Evidence Map places directional transcriptional enrichment beside topology evidence on separate zero-centered axes. Exact pathway identity is required for alignment, and missing topology remains visibly unavailable rather than becoming zero.

The TF / Pathway Activity workspace uses a separate signed prior-knowledge network. PROGENy is the default pathway network, while the backend can expose another bundled network such as CollecTRI for transcription-factor sources.
For a chosen RNA-seq comparison, NotchBio aligns the DESeq2 Wald statistic by gene symbol to network targets. It sets non-target gene weights to zero and fits all eligible sources through a vectorized univariate model.
The reported activity score is the t-value of the fitted slope. P-values are two-sided and FDR is adjusted across the scored sources. Sources with fewer than five detected targets are excluded under the current default.
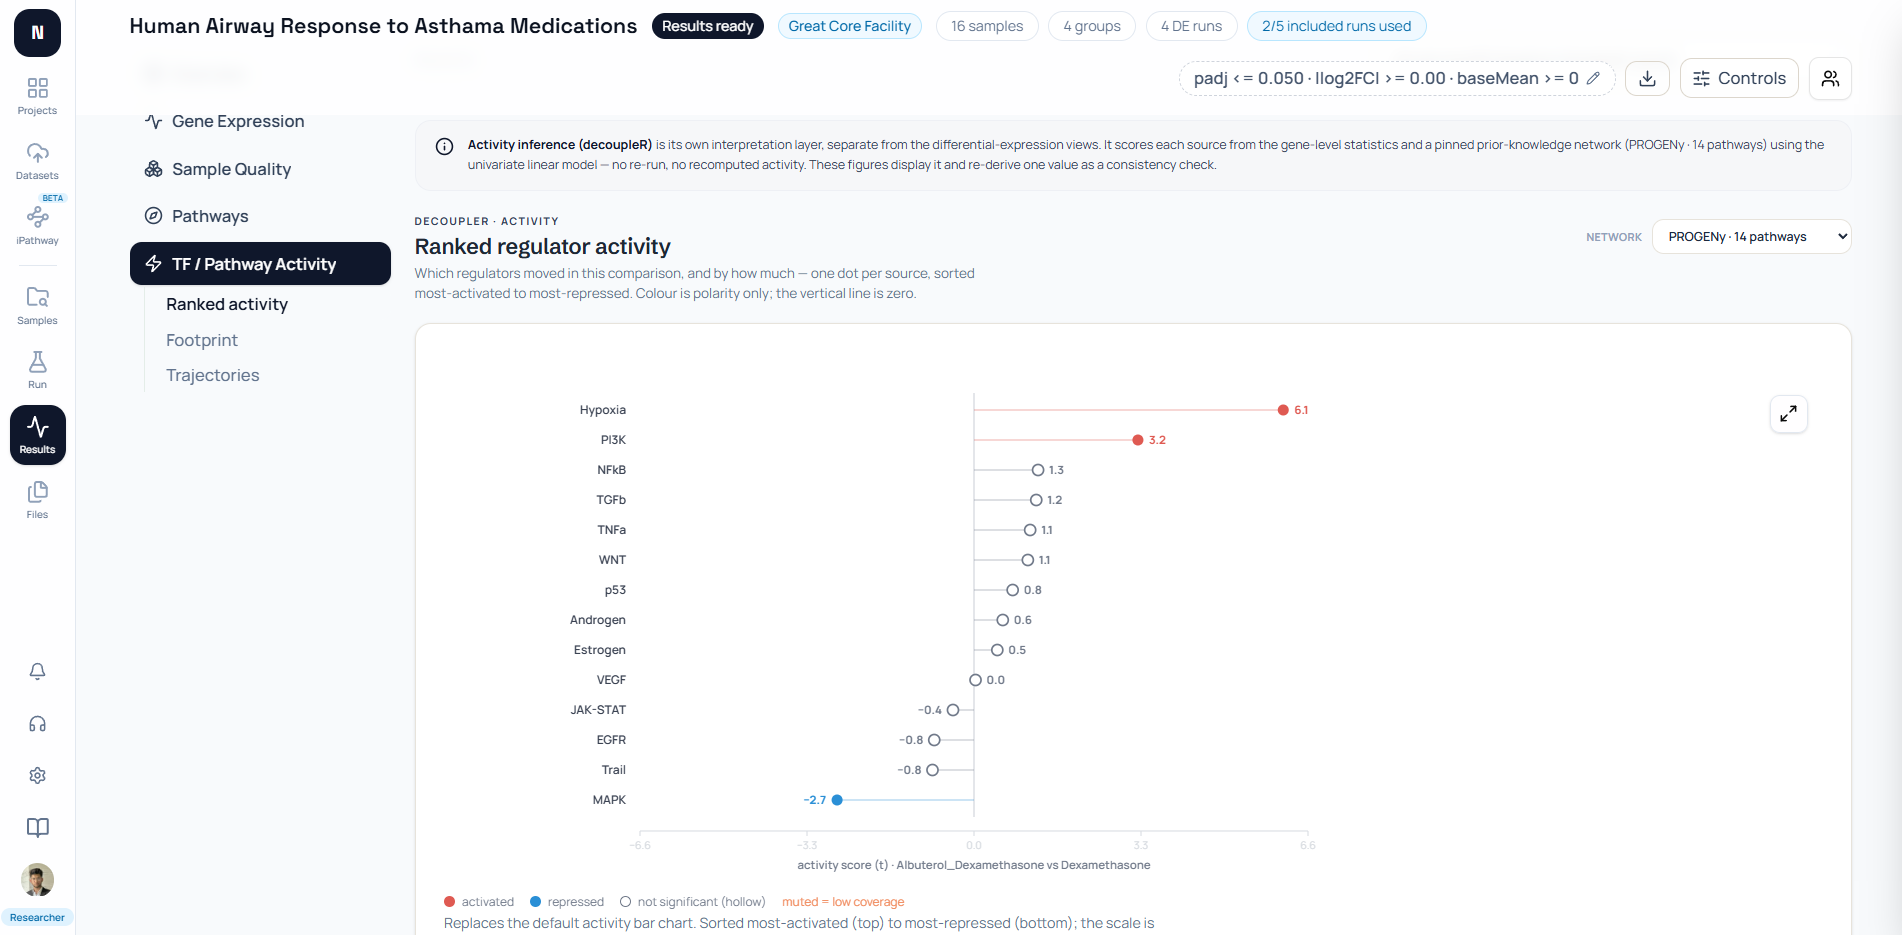
NotchBio’s footprint returns every detected target plus sufficient statistics for non-target genes. The client can re-derive the full-model score and compare it with the server value as a consistency check.
The activity trajectory is related but uses a different readout. NotchBio row-z-scores the VST expression matrix across samples, averages within ordered groups, and applies the same signed network model to each group mean.
Three uses of the word activity
A regulator-footprint score, a topology-propagation direction, and a member-expression summary are different quantities. Always name the method beside the word “activity,” and never label a member-expression heatmap as pathway activation.
Which pathway result should you report?
Report the result that matches the biological question, and show the complementary layer when it changes or qualifies the interpretation.
Use enrichment when the question concerns annotated membership: which processes contain an unusual share of selected genes, or which gene sets concentrate near one end of a ranked contrast.
Use activity inference when the question concerns a modeled regulator state: do weighted downstream targets behave as expected under higher or lower pathway or transcription-factor activity?
Neither result should win because its FDR is smaller. Their hypotheses, tested feature sets, and null models differ, so p-values are not a contest between evidence layers.
For a strong report, state the method, resource version, input statistic, effect direction, uncertainty, coverage, and drivers. Add the footprint or leading edge that makes the score inspectable.
Also preserve the measured gene universe. Filtering low-count genes is normal, but silently changing the universe between layers changes both enrichment expectations and network coverage.
If the result guides an experiment, nominate a falsifiable validation. For example, a predicted MAPK increase could motivate a phospho-ERK assay, while a TF footprint could motivate perturbation followed by target-gene measurement.
When both layers agree, describe convergence without claiming independence if they reuse the same gene-level measurements. When they conflict, preserve the conflict and explain the contracts instead of averaging the scores.
When only one layer is available, say so. Missing activity or topology is not a neutral zero, and an unsupported source should not be colored as inactive.
When should you avoid the word “activation”?
Avoid “activation” when the evidence shows only gene-set overlap, ranked enrichment, member expression, co-expression, correlation, or an unvalidated model score.
For enrichment, prefer “positively enriched,” “negatively enriched,” “up-skewed,” or “down-skewed.” These phrases describe the observed ranking without adding a mechanistic claim.
For a signed footprint, “predicted higher activity” is defensible when the network, model, comparison, coverage, score, and uncertainty are reported. “The pathway was activated” is stronger and usually requires orthogonal experimental evidence.
Phosphoproteomics, reporter assays, perturbation experiments, imaging, or targeted biochemical measurements can test the inferred mechanism. Transcriptomic activity inference is best treated as a prioritized, auditable hypothesis.
The practical rule is simple: name the model before naming the state. A PROGENy ULM score supports agreement with a pathway-response footprint; it does not directly measure phosphorylation, molecular flux, or causality.
Use How to Interpret Pathway Analysis Results first if you need to review score, direction, uncertainty, coverage, and missing evidence.
The next guide asks how biological pathways are connected through shared genes, leading edges, regulatory links, and co-expression. These four edge definitions must remain separate.
Further reading
Read another related post
Salmon to Differential Expression in Python with PyDESeq2
A pipeline-focused PyDESeq2 tutorial: load Salmon quant.sf into a count matrix, fit a DeseqDataSet, run Wald tests, apply apeGLM shrinkage, export DEGs. No R.
TutorialHow to Run DESeq2 in R from Salmon quant.sf Files
DESeq2 in R from Salmon counts: import quant.sf with tximeta, build a DESeqDataSet, run the Wald test, apply apeglm shrinkage, and export a ranked DEG table.
TutorialHow to Build a DESeq2 Count Matrix in Python
Python tutorial: parse featureCounts output, aggregate Salmon quant.sf, build a tx2gene map, and save a DESeq2-ready integer count matrix with pandas.