How to Interpret Pathway Analysis Results
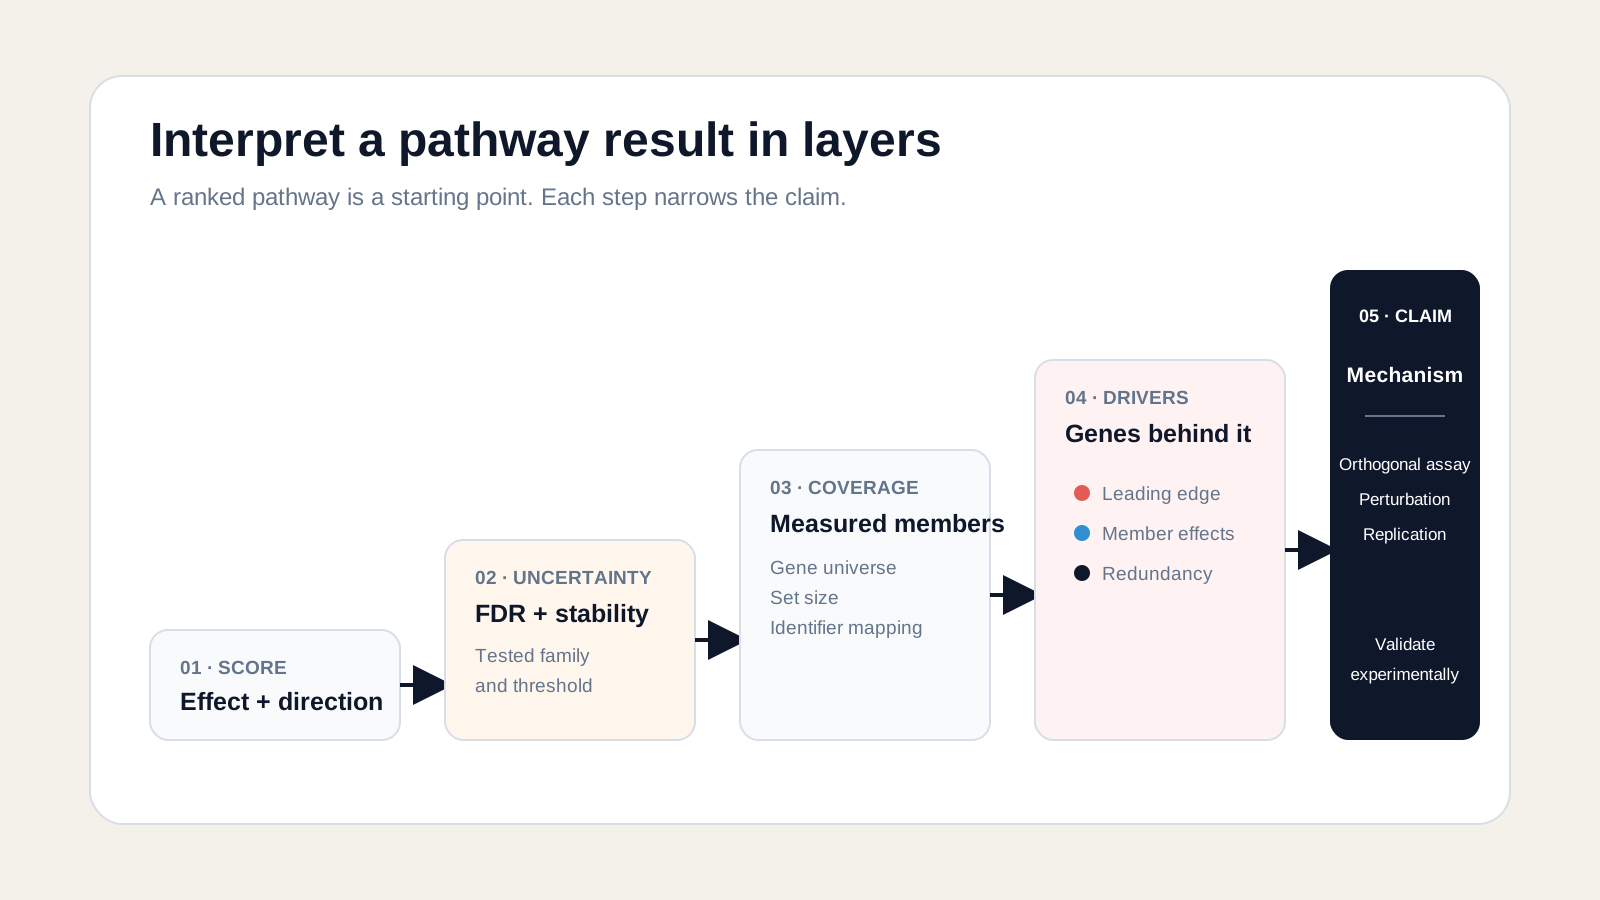
Interpret pathway analysis by reading the method, effect, direction, FDR, tested size, measured coverage, and driver genes together. A pathway name alone is never the result.
A ranked table is a map of statistical evidence, not a list of mechanisms. The strongest interpretation moves from the pathway-level statistic to the genes behind it, then asks whether another method and an independent experiment support the same story.
What should you read first in pathway results?
Read the comparison and method before the top pathway. They define what the score, direction, null hypothesis, tested gene universe, and correction family actually mean.
Confirm which samples or conditions were contrasted and which side is the reference. “Positive” is meaningless until the comparison direction is explicit. A reversed contrast reverses many directional scores without changing the underlying measurements.
Then identify the method family. Over-representation analysis tests overlap in a selected gene list. Ranked-set methods test where members fall in a complete ranking. Topology methods propagate change through signed edges. Activity models compare observed genes with weighted targets.
These methods can place the same pathway name beside different statistics. An odds ratio, normalized enrichment score, rank-sum z-score, topology perturbation score, and regulator activity coefficient are not interchangeable effect sizes.
| Read | Ask | Safe interpretation |
|---|---|---|
| Comparison | Which condition is numerator or reference? | Direction within this contrast |
| Method | What null hypothesis was tested? | Membership, rank shift, wiring, or footprint evidence |
| Score | What does zero mean? | Effect position on that method’s scale |
| FDR | How many pathways were tested together? | Multiplicity-adjusted evidence |
| Size and coverage | How many members could contribute? | Breadth and data support |
| Driver genes | Which measured genes created the signal? | A traceable biological hypothesis |
Do not sort by FDR and stop. Two pathways can have similar FDR values but different effect sizes, coverage, coherence, or biological specificity. A broad pathway with 300 measured members does not tell the same story as a focused pathway with 20.
What does pathway FDR mean?
Pathway FDR estimates the expected false-discovery proportion among results called significant under a defined testing procedure. It is not the probability that one named pathway is false.
If 20 pathways pass an FDR threshold of 0.05, the procedure aims to limit the expected false-discovery share across that selected family. It does not promise that exactly one result is wrong, nor does it assign a 5% truth probability to every row.
Use the adjusted value produced for the relevant method and collection. A nominal p-value ignores the number of pathway hypotheses tested. The PLOS pathway-enrichment guidance recommends interpreting corrected values and checking how method and database choices affect results.
An FDR threshold is a decision rule, not a biological boundary. A pathway at 0.049 and one at 0.051 are not fundamentally different. Report the full values, effect sizes, and ranking, then describe near-threshold results as uncertain rather than converting them into opposite biological states.
Correction also depends on the tested family. Running Hallmark, Reactome, and Gene Ontology separately can create different correction families. Record the collection, version, filters, and whether adjustment occurred per collection or over all tested sets.
Do not rescue a weak result with a nominal p-value
If the adjusted result is not significant, describe it as a ranked or suggestive pattern. Switching to the smaller nominal p-value after seeing the output defeats the multiple-testing control.
How should you interpret enrichment direction?
Enrichment direction describes where pathway members concentrate in a gene ranking. Positive and negative enrichment do not, by themselves, prove pathway activation or inhibition.
For a ranking ordered from genes higher in treatment to genes higher in control, positive enrichment means members lean toward the treatment-up end. Negative enrichment means they lean toward the opposite end. The exact labels depend on the ranking metric and contrast direction.
A directional score is set-level evidence. Members need not all move together, and individual members need not pass a gene-level FDR threshold. The result says that their positions are collectively non-random under the method’s model.
This is why “up-skewed” and “down-skewed” are safer labels for rank-based enrichment. “Activated” and “inhibited” should be reserved for a signed topology or regulator model that encodes how positive and negative relations combine.
Effect and significance also answer different questions. A large directional score with weak FDR may reflect noise, low coverage, or a small study. A modest score with strong FDR may be stable but biologically broad. Inspect both before prioritizing follow-up.
What are leading-edge genes?
Leading-edge genes are the pathway members that contribute most directly to a ranked-set enrichment signal. They connect a pathway score back to measured gene-level evidence.
In classical GSEA, the leading edge contains members encountered at or before the running-sum extremum for positive enrichment, or at or after it for negative enrichment. The GSEA User Guide calls this subset the core that accounts for the signal.
Other ranked-set implementations may define drivers with related but not identical rules. Always record the method. A “leading edge” from one scoring engine should not be assumed to match a different engine’s subset exactly.
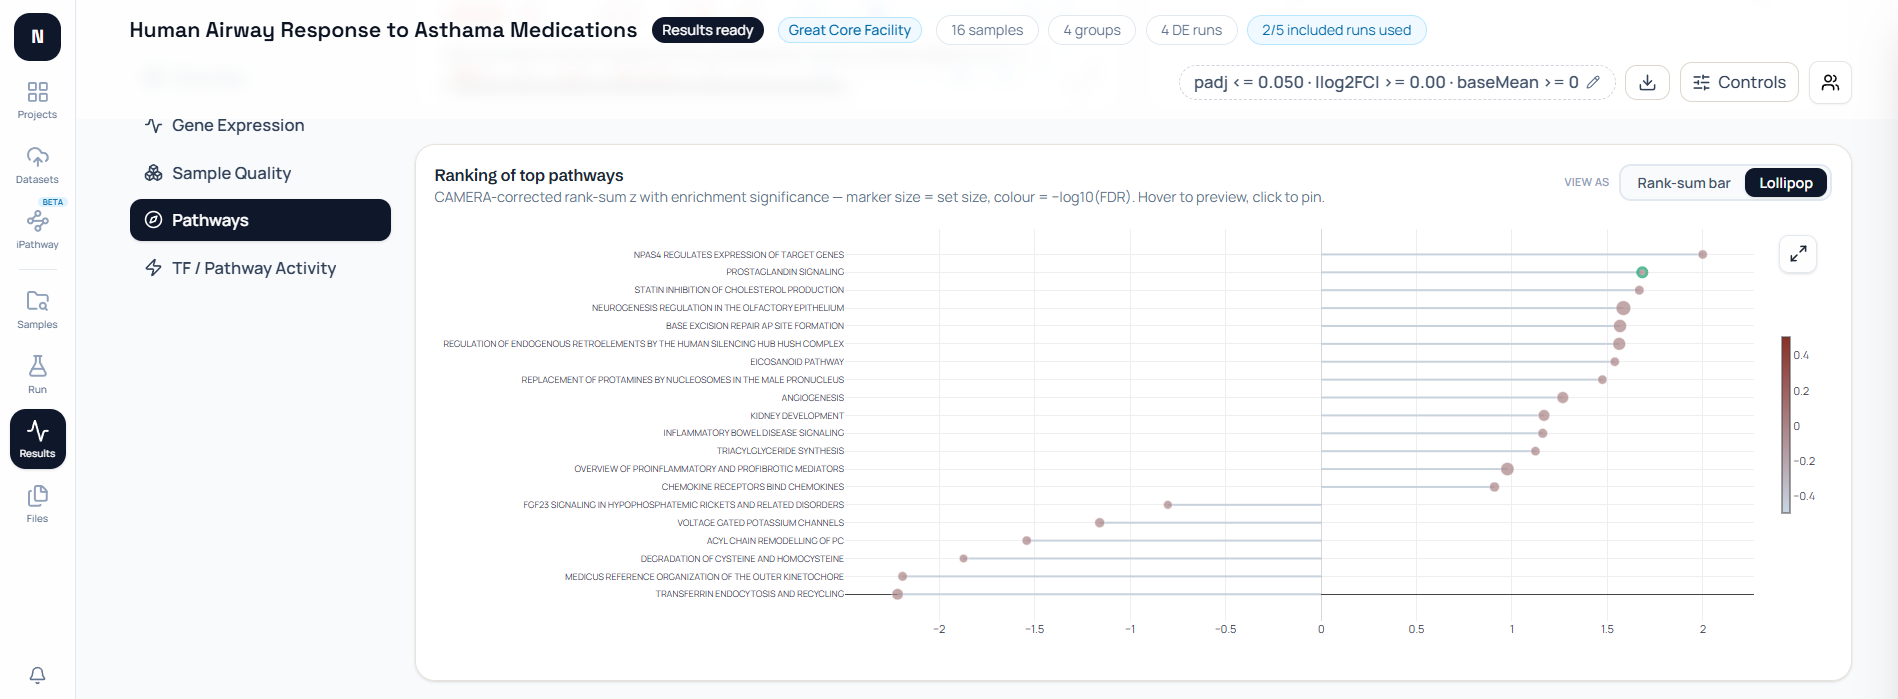
NotchBio makes this distinction explicit in its implementation. The ranked pathway table uses a CAMERA-corrected rank-sum z, while the displayed leading edge comes from a GSEA-style weighted running-sum curve built over the same signed gene ranking.
The two views share genes and ranking direction, but the leading-edge subset is not an additive decomposition of the rank-sum z. Treat it as a focused gene-level explanation of where pathway members concentrate, not a list of coefficients that sum to the displayed score.
Read each driver gene’s effect direction, magnitude, uncertainty, and expression pattern. A gene can contribute because it lies far into the ranked tail while still missing an individual FDR cutoff. Set-level evidence pools coordinated information; it does not silently promote every member to significance.
Look for recurring drivers across related pathways. A gene repeated in many leading edges may explain why several terms rank together. It can be an informative hub, but repetition may also reflect database annotation density rather than special causal importance.
How do pathway size and coverage change interpretation?
Pathway size and measured coverage determine how much evidence could contribute to a score. Interpret the tested overlap, not the database’s full annotation count alone.
A database pathway may contain 180 genes, while only 75 have usable statistics in the experiment. The analysis operates on those measured members. Low coverage can make a pathway unstable, unrepresentative, or impossible to test under a minimum-size rule.
Very small tested sets can be driven by one or two extreme genes. Very large sets can collect broad stress or housekeeping responses and become difficult to describe as a specific mechanism. Size filters reduce these problems but cannot remove them completely.
The background also changes the question. For RNA-seq ORA, the defensible universe is usually the genes that could have entered the differential-expression test, not every gene in the genome. Including impossible-to-detect genes changes the expected overlap and can inflate results.
Ranked-set methods usually use the complete valid ranking after identifier cleaning. Record how duplicate identifiers, missing statistics, and unmapped symbols were handled. Silent mapping loss can turn a well-curated pathway into a sparse and biased tested set.
Coverage is not an effect size. A pathway with high coverage can still have no coordinated signal, while a moderately covered pathway can show a strong pattern. Use coverage to judge whether the score represents the pathway annotation adequately.
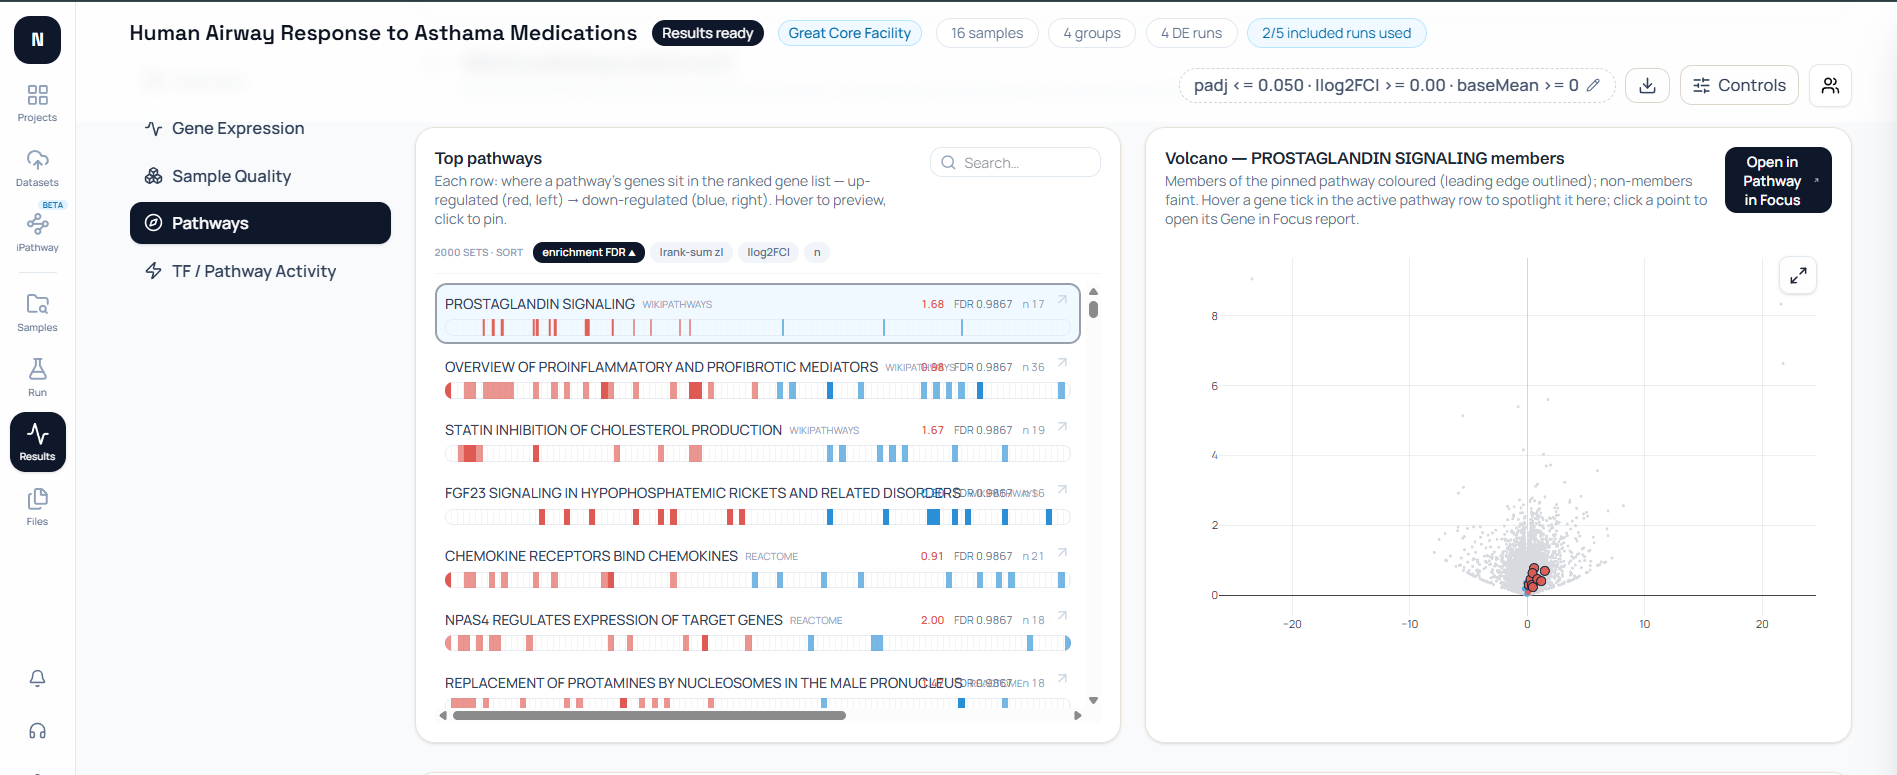
Inspect the direction distribution inside the set. A positive average can hide two opposing branches, a small cluster of extreme genes, or one coherent leading edge against many neutral members. Barcodes, member volcano plots, and expression heatmaps reveal that structure.
When comparing two pathways, do not interpret the larger marker as stronger biology until you know what marker size encodes. It may represent database size, measured size, overlap count, or a visual confidence cue rather than effect magnitude.
Why do pathway databases return redundant terms?
Pathway results are redundant because databases describe overlapping biology at different boundaries and resolutions. Several names may be reporting largely the same measured genes.
Reactome, KEGG, WikiPathways, Gene Ontology, and MSigDB collections were curated for different purposes. A receptor cascade can appear as a broad signaling pathway, a disease pathway, a downstream transcriptional program, and several nested subpathways.
Compare member overlap and leading-edge overlap before counting these as independent discoveries. Jaccard similarity divides the intersection by the union. The overlap coefficient divides by the smaller set and detects when a focused pathway is almost contained inside a broad one.
The EnrichmentMap protocol turns pathways into nodes and connects sets with shared genes. This helps organize themes, but its edges encode overlap. They do not represent activation, inhibition, binding, or causal flow.
Choose a representative term using statistical strength, specificity, coverage, and fit to the biological question. Keep the related terms available as supporting detail. Deleting every redundant label can hide useful distinctions in pathway scope.
NotchBio’s functional report groups overlapping sets with a combined Jaccard and overlap coefficient. The best-FDR set represents the theme while collapsed names remain recorded. This is a readability step over member overlap, not a new biological test.
How should enrichment and topology be compared?
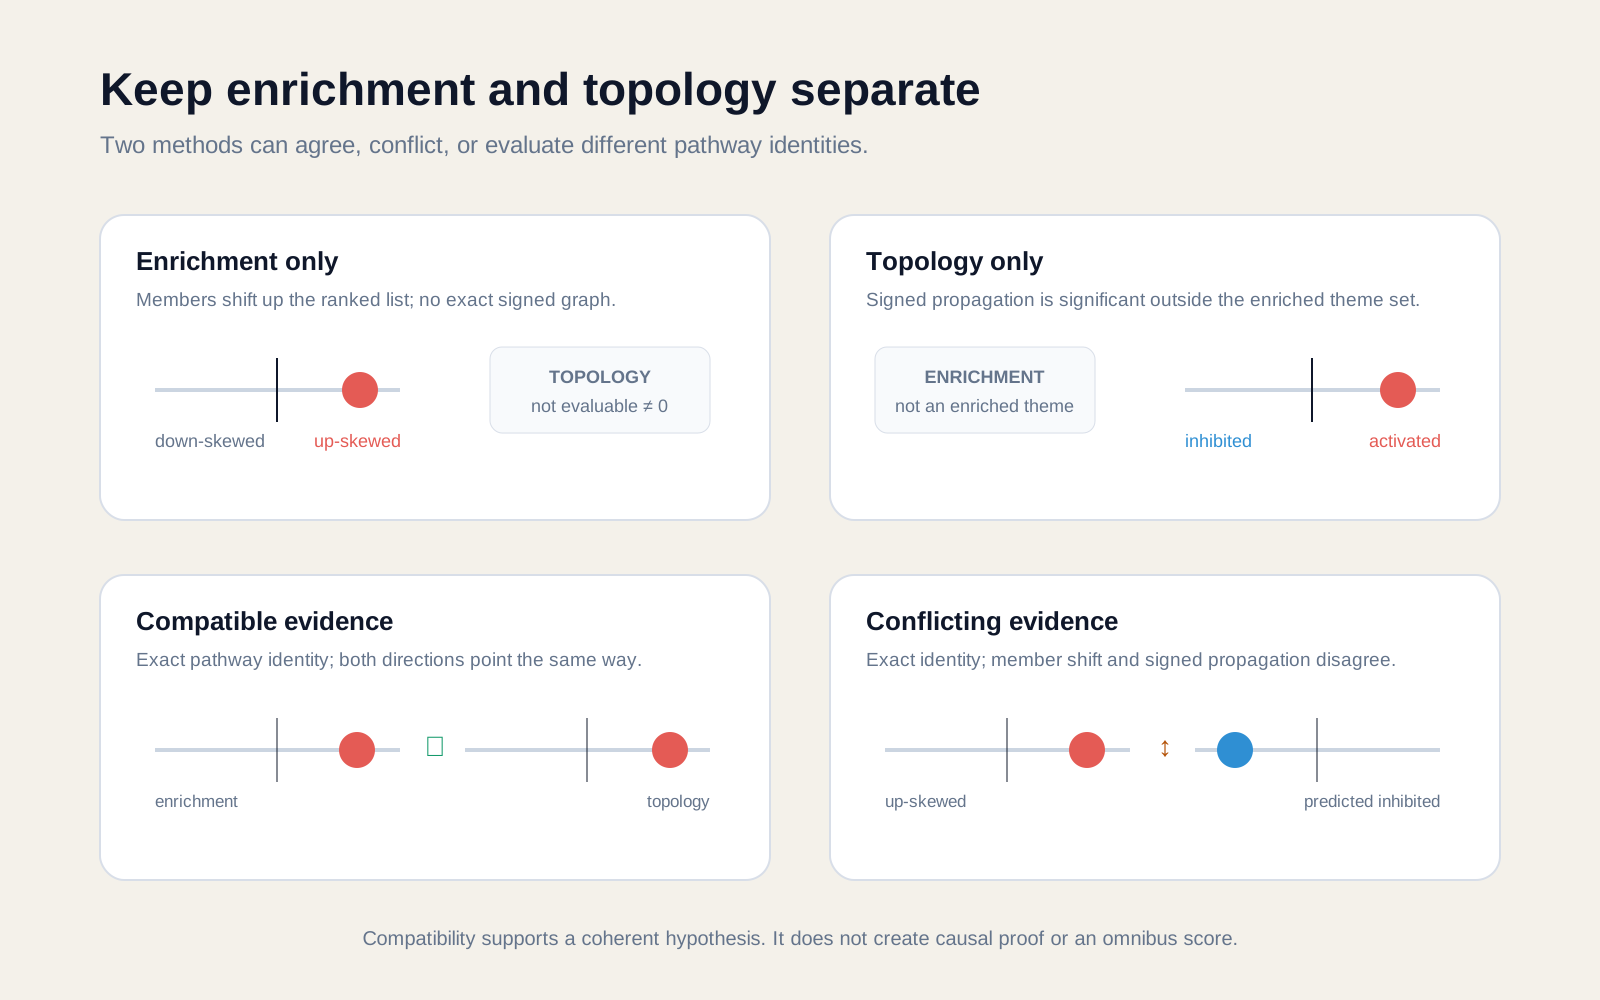
Compare enrichment and topology only for an exact pathway identity that both methods evaluated. Keep their scores and FDR values separate, then label direction as compatible or conflicting.
Enrichment asks whether member genes shift together in a list or ranking. Topology analysis asks how measured changes propagate through a signed, directed graph. A downregulated inhibitor can produce a downstream effect that a membership-only test cannot represent.
Compatible directions support a coherent hypothesis: members lean upward and the signed graph predicts activation, or members lean downward and the graph predicts inhibition. This is convergence across models, not proof of pathway flux or causality.
Conflict is informative. An up-skewed member set can coexist with predicted inhibition when inhibitory edges, feedback, branch structure, or a few influential nodes dominate propagation. Check graph coverage, edge provenance, driver genes, and the contrast before choosing a story.
Never average the two statistics into an undocumented omnibus score. Their scales and null hypotheses differ. Report the enrichment statistic, topology statistic, uncertainty, and relationship state as separate columns.
What does a missing topology result mean?
A missing topology result means the method could not return an evaluable signed-graph result for that pathway and scope. It does not mean zero perturbation or no biological effect.
The pathway may lack an exact graph in the selected topology source. Its graph may be unsupported for the organism, fail coverage requirements, remain pending, or be unavailable because computation failed. Each state has a different remedy and must be stored separately.
“Not significant” is different. It means the method evaluated the pathway and its evidence did not cross the chosen threshold. Only an evaluated result can be called nonsignificant.
Do not convert missing values to zero before plotting, correlating, or averaging methods. Zero is a valid numerical position on many score scales. Substitution would make absence look like measured neutrality and can create false agreement.

How does NotchBio connect pathways to genes?
NotchBio links a pathway rank to barcodes, member-gene statistics, leading-edge rows, expression views, provenance, and separate topology evidence under one shared analysis scope.
The scope controls keep comparison, gene-set library, gene-level cutoff, and pathway FDR aligned across the workspace. This matters because switching a contrast changes the relevant ranking and member statistics; it does not create an interaction test between contrasts.
The backend builds directional rank-sum enrichment, applies a CAMERA-style variance adjustment for inter-gene correlation, and reports Benjamini-Hochberg FDR across scored sets. The functional report restricts measured set sizes and records the tested-gene background and identifier mapping.
For pathway focus, the code returns the set size, measured members, score, p-value, FDR, direction, leading-edge count, member rows, ranked curve, expression heatmap, and neighboring sets. This makes the set-level result traceable without pretending every panel is an independent test.
The pathway ranking and leading edge use related but separate statistics. The ranking is the CAMERA-corrected rank-sum z; the leading edge is extracted from the GSEA-style running-sum curve over the same signed ranking.
The Pathway Evidence Map aligns enrichment and topology by exact identity. It labels compatible, conflict, both-tested, enrichment-only, topology-only, and not-evaluable states. Pending, unsupported, and unavailable topology remain explicit.
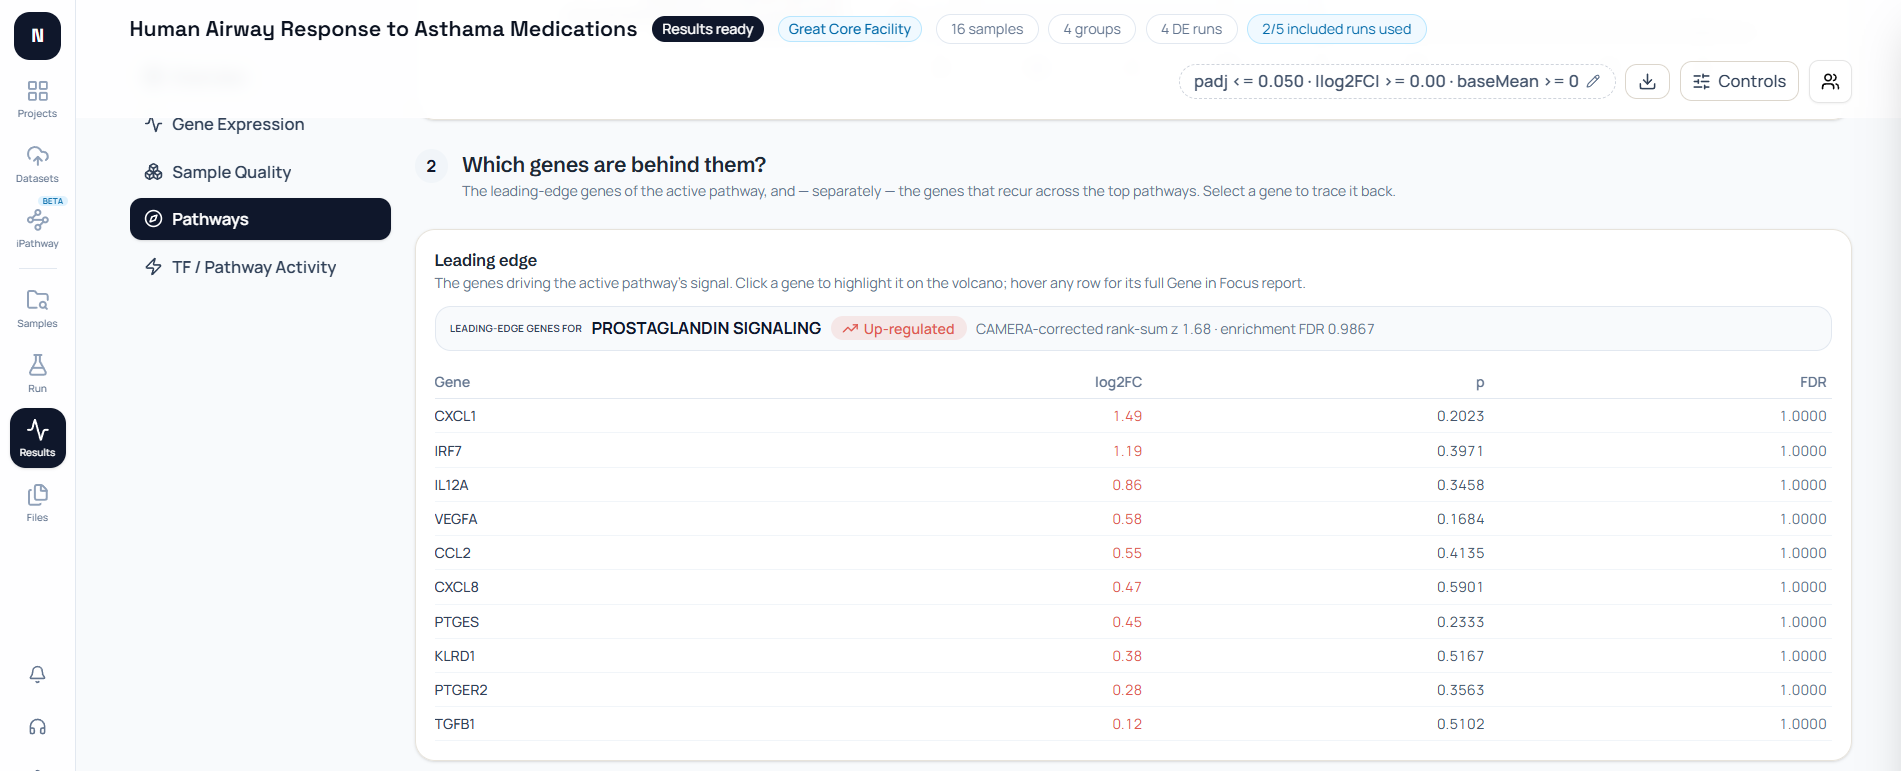
The visible PROSTAGLANDIN SIGNALING example is deliberately useful because it is not significant. Its pathway FDR is about 0.99, and the displayed leading-edge genes also have FDR values of 1.0000. It shows navigation and evidence structure, not a treatment mechanism.
An honest interpretation is: “Prostaglandin signaling appears in the directional ranking, and these measured members contribute to its position, but neither the pathway nor displayed genes meet the selected FDR threshold.” Anything stronger outruns the evidence.
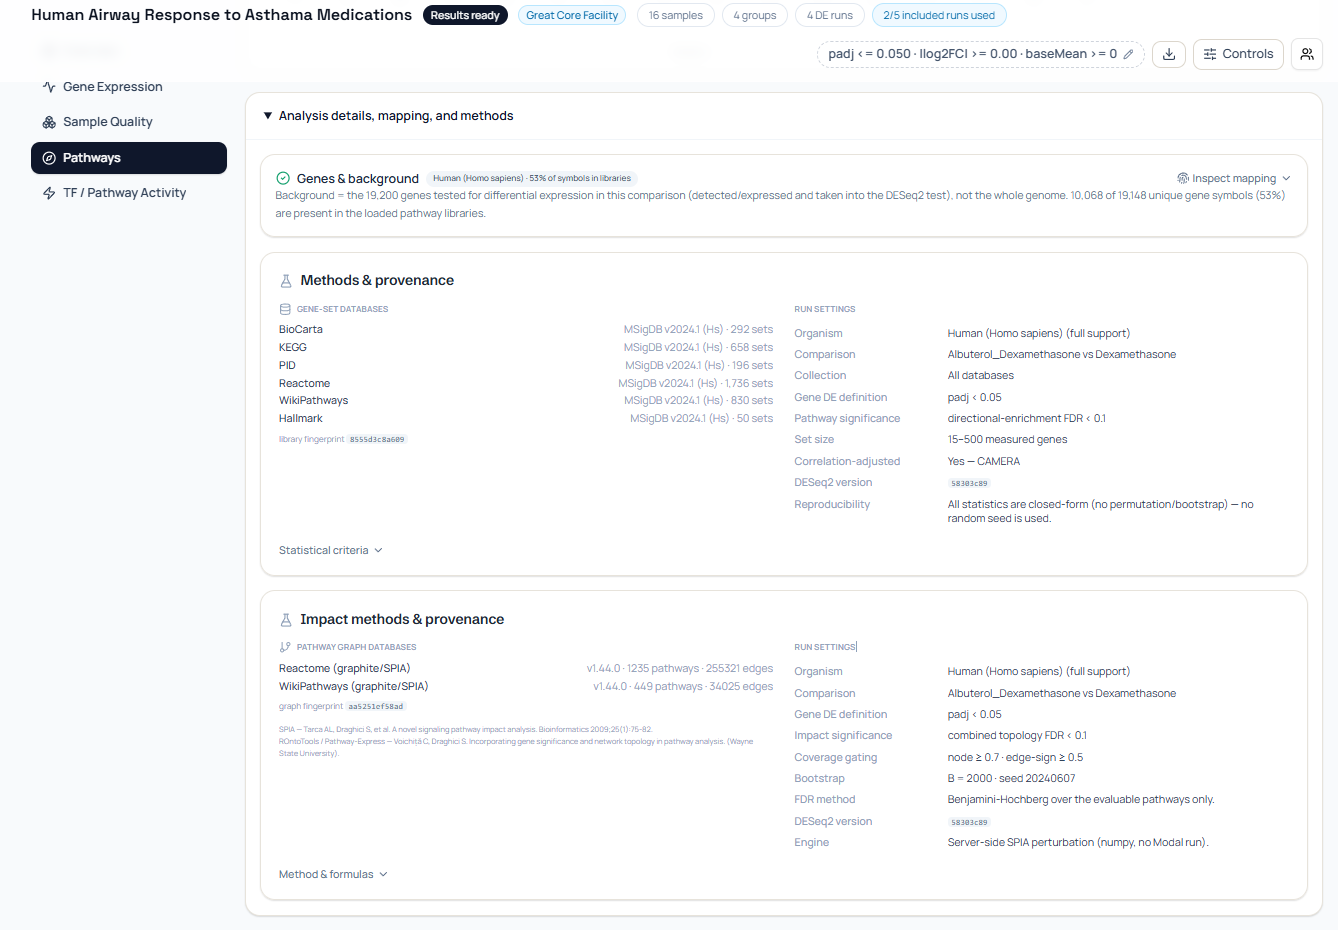
The analysis-details panel records library versions, background, mapping coverage, CAMERA usage, graph databases, bootstrap settings, engine, and citations. Those fields let a reviewer reproduce the scope and understand why one evidence layer may be present while another is absent.
Which claims require experimental validation?
Claims about causal mechanism, biochemical activity, therapeutic response, or phenotype require evidence beyond pathway statistics. Enrichment is a hypothesis generator, not a molecular assay.
Use orthogonal data that matches the claim. Protein abundance can support translation, phosphoproteomics can support signaling-state changes, metabolomics can support pathway flux, and targeted perturbation can test whether a proposed regulator changes the phenotype.
Replication matters at two levels. First, confirm the RNA-seq effect in independent biological samples with the same design. Second, test whether the pathway pattern appears in an external dataset, model, or assay without changing thresholds after seeing the result.
Literature agreement is context, not validation of your samples. A known pathway can still be absent in one experiment. A novel pattern can still be real. Preserve effect estimates, uncertainty, and negative results so readers can judge both cases.
Before writing the biological claim, use this sequence:
- State the exact contrast and method.
- Report effect direction and adjusted uncertainty.
- Name measured coverage and leading-edge genes.
- Separate redundant terms into themes.
- Compare only evaluable, exact-matched evidence layers.
- Mark missing evidence as missing.
- Frame the mechanism as a testable hypothesis.
For diagram structure and overlay limits, return to How to Build a Biological Pathway Diagram. For method choice, read pathway enrichment analysis and ORA versus GSEA with clusterProfiler.
If overlapping terms dominate, use the GO term redundancy tutorial.
The next distinction matters: enrichment measures coordinated membership or rank shift, while activity inference uses a signed target model. Continue with Pathway Enrichment vs Pathway Activity.
Further reading
Read another related post
Reference Genome Types for RNA-Seq: Does the Choice Change Results?
Compare GENCODE, Ensembl, RefSeq, and UCSC reference annotations for RNA-seq and learn how genome assembly and GTF choice change counts and DEGs.
Tutorialfastp vs Trimmomatic: RNA-Seq Adapter Trimming Tutorial
When adapter trimming helps, when it hurts, and how to run Trimmomatic and fastp on RNA-seq data with the parameter choices that actually matter.
TutorialHow to Run FastQC and MultiQC on Multiple FASTQ Files
A hands-on guide to automating RNA-seq QC across dozens of samples using FastQC and MultiQC, with bash and Python scripts for parsing and flagging failures.