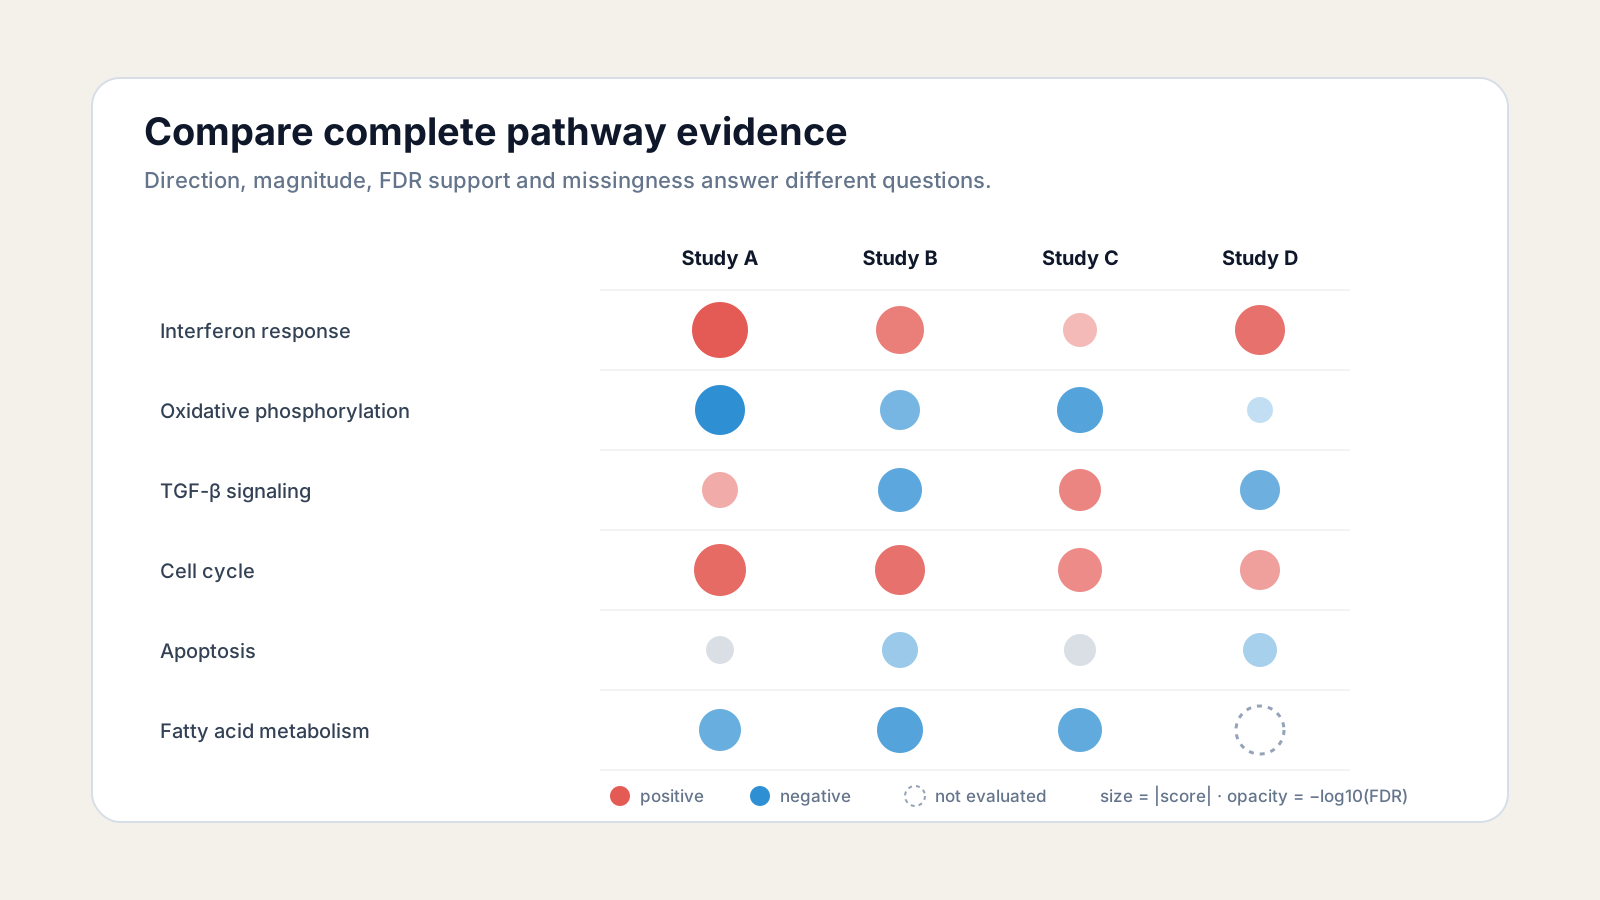
How to Compare Pathways Across Datasets
Compare pathways across datasets by harmonizing pathway definitions, retaining complete directional scores, and matching the statistical unit to the study design. Never compare significant pathway names alone.
A valid comparison preserves four things: what pathway was tested, what contrast produced the score, which genes were measurable, and how uncertainty was estimated. If any one changes silently, an apparent biological disagreement may be a data-contract mismatch.
This guide moves from multiple contrasts in one RNA-seq fit to independent studies, different platforms, and cross-species data. It also shows where visual comparison ends and formal meta-analysis begins.
What does it mean to compare pathways across datasets?
Pathway comparison asks whether the same defined biological program shows a similar direction, magnitude, and level of support across compatible analyses.
“Dataset” can mean two contrasts from one fitted experiment, two separately processed RNA-seq studies, RNA-seq versus microarray, or two species. Those cases do not share one statistical solution.
Within one fit, pathway scores can often be aligned directly because normalization, annotation, model, and gene-set collection are shared. Across studies, the valid unit is usually a study-specific effect or rank plus its uncertainty.
Across platforms, raw expression scales are incompatible. Across species, even the feature map changes because one gene can have zero, one, or several orthologues.
| Comparison level | Valid unit | Main risk |
|---|---|---|
| Same fitted experiment | contrast-level pathway score | contrasts share samples and are dependent |
| Separate runs, same design | harmonized pathway effect or rank | pipeline, batch, and version drift |
| Different platforms | standardized effect, rank, or study-level evidence | scale and probe-definition mismatch |
| Different species | orthologue-aware pathway evidence | one-to-many mapping and pathway divergence |
How should gene identifiers and pathway versions be harmonized?
Harmonize identifiers before analysis, then join pathway results by species, collection, stable pathway identity, and release. Do not join by a cleaned display name.
Strip Ensembl version suffixes only when the reference release supports that operation. Resolve duplicate mappings with a declared rule, record unmapped genes, and keep the measured gene universe for every dataset.
Pathway libraries also change. Members can be added, removed, renamed, merged, or split. The MSigDB Hallmark collection was designed to reduce redundancy, but even a concise collection still needs a recorded release and species.
For Reactome, keep the stable identifier and release beside the name. A text match such as “interferon signaling” is not proof that two results tested the same member set, hierarchy node, or signed graph.
A defensible key looks like this:
species | collection | collection_release | stable_pathway_id | contrasthuman | Reactome | <release ID> | R-HSA-913531 | treated_vs_controlRecord mapping coverage as measured_members / pathway_members. A score based on 80 measured members is not automatically commensurate with a score based on 12.
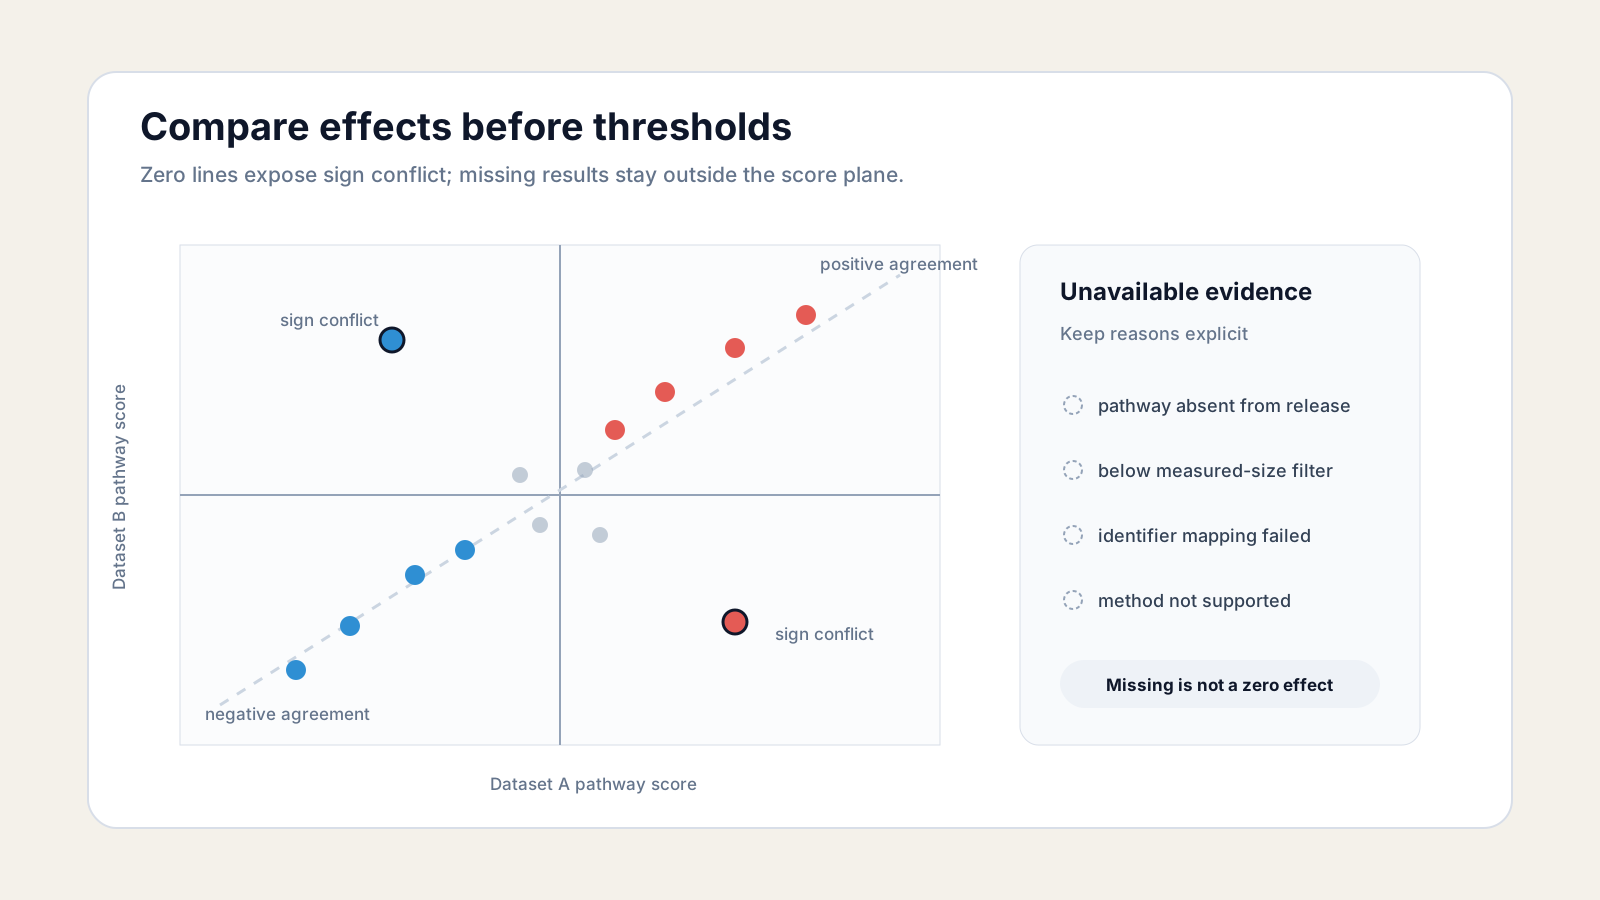
Do not convert missing pathways to zero
A missing result can mean the pathway was absent from that library release, failed the size filter, lacked mapped genes, or was unsupported by the method. Zero means an evaluated null-direction score. Keep those states distinct.
Why should you compare scores instead of significant lists?
Complete scores preserve direction and near-threshold evidence; significant lists discard both and create artificial disagreement around the FDR cutoff.
Suppose one study reports pathway FDR 0.049 and another reports 0.051 with similar positive scores. A hit-list comparison calls them discordant even though the evidence is nearly identical.
The reverse problem also occurs. Two studies can both pass FDR while their scores point in opposite directions. A shared “significant” label hides a biologically important conflict.
Start with a pathway-by-dataset table containing score, standard error when available, p-value, FDR, tested size, measured size, and evidence type. Keep enrichment, topology propagation, and regulator activity in separate columns.
Use Spearman correlation to compare rank order, sign agreement to compare direction, and a score scatter to expose magnitude. Report all three because a strong rank correlation can coexist with a few consequential sign reversals.
FDR is study-specific evidence after multiplicity correction. It is not an effect size, so do not correlate -log10(FDR) and call the result biological agreement.
How do you build a pathway comparison table in Python?
Build one tidy table per analysis, validate its provenance fields, concatenate the rows, and pivot only for a specific visualization or concordance calculation.
The minimum public contract should contain dataset, contrast, species, collection, collection_release, pathway_id, pathway, evidence_type, score, fdr, set_size, and measured_size.
Keep score numeric and nullable. Add a separate availability field such as evaluated, library_absent, too_few_measured, mapping_failed, or unsupported_method.
This deterministic example compares two already harmonized directional-enrichment tables. It refuses duplicate pathway keys, preserves missing rows, and calculates agreement only where both scores were evaluated.
from pathlib import Pathimport numpy as npimport pandas as pd
KEY = ["species", "collection", "collection_release", "pathway_id"]REQUIRED = KEY + [    "dataset", "contrast", "pathway", "evidence_type", "score", "fdr",    "set_size", "measured_size", "availability",]
def load_pathways(path: str) -> pd.DataFrame:    table = pd.read_csv(Path(path))    missing = sorted(set(REQUIRED) - set(table.columns))    if missing:        raise ValueError(f"Missing columns: {missing}")    if table.duplicated(KEY).any():        raise ValueError("Pathway key is not unique within this dataset")    for field in ["dataset", "contrast", "evidence_type"]:        if table[field].nunique(dropna=False) != 1:            raise ValueError(f"Expected exactly one {field} per input table")    return table[REQUIRED].copy()
a = load_pathways("study_a_pathways.csv").add_suffix("_a")b = load_pathways("study_b_pathways.csv").add_suffix("_b")
comparison = a.merge(    b,    how="outer",    left_on=[f"{column}_a" for column in KEY],    right_on=[f"{column}_b" for column in KEY],    validate="one_to_one",    indicator=True,)
if a["evidence_type_a"].iat[0] != b["evidence_type_b"].iat[0]:    raise ValueError("Do not compare scores from different evidence types")
paired = comparison.loc[    comparison["score_a"].notna()    & comparison["score_b"].notna()    & comparison["availability_a"].eq("evaluated")    & comparison["availability_b"].eq("evaluated")].copy()
if len(paired) < 3:    raise ValueError("At least three evaluated pathway pairs are required")
rho = paired["score_a"].rank().corr(paired["score_b"].rank())sign_agreement = np.mean(np.sign(paired["score_a"]) == np.sign(paired["score_b"]))
print({    "n_a": int(comparison["score_a"].notna().sum()),    "n_b": int(comparison["score_b"].notna().sum()),    "n_paired": len(paired),    "spearman_rho": round(float(rho), 3),    "sign_agreement": round(float(sign_agreement), 3),})
Do not fill the outer join with zero. Inspect _merge and both availability columns to learn whether a pathway is absent because of a collection mismatch, mapping loss, filtering, or a genuinely unsupported method.
Spearman correlation answers whether ranks agree among paired pathways. Sign agreement answers whether directions match. Neither accounts for uncertainty, dependence, or heterogeneity, so they are descriptive diagnostics rather than a meta-analysis.
Add bootstrap intervals only when the resampling unit matches the design. Resampling pathway rows treats overlapping pathways as independent and is usually not a valid biological uncertainty model.
How do you compare multiple contrasts in one experiment?
Compare contrasts from one fit on a shared pathway definition, but remember that estimates reuse samples and are statistically dependent.
Fit the full experimental design once, then extract planned contrasts. The DESeq2 vignette explains how contrasts derive from fitted coefficients and how interaction terms answer difference-of-differences questions.
For each contrast, generate the same gene-level statistic and rerun the same pathway method with identical size filters, universe rules, and collection release. Join the complete pathway tables, not just significant rows.
Direction must follow the numerator and denominator. If treated_vs_control is positive for an up-skewed pathway, reversing the contrast should reverse the gene statistic and pathway direction.

If the question is whether treatment response differs by genotype, cell line, sex, or time, side-by-side contrasts are descriptive. The formal test requires an interaction term or another planned difference-of-differences contrast.
For a deeper treatment of coefficients and reference levels, use the DESeq2 contrasts guide.
How do you compare independent RNA-seq studies?
Analyze each study within its own design, harmonize the outputs, and combine study-level evidence only after checking heterogeneity.
Do not append count matrices and add a study label when condition and study are confounded. A joint model cannot distinguish biology from study if one study contains only treated samples and another only controls.
Within each study, use its valid normalization and covariates, then calculate the same directional pathway result. The workflow should preserve study label, effect direction, pathway release, measured coverage, and uncertainty.
Rau, Marot, and Jaffrézic showed that RNA-seq studies can be combined through study-level evidence while accounting for study-specific biological and technical variation (BMC Bioinformatics, 2014). Their method combines gene-level p-values; the same design principle applies before pathway-level synthesis.
Ramasamy and colleagues outline the broader sequence: select compatible studies, prepare each dataset, harmonize annotation, resolve many-to-many mappings, and only then combine estimates (PLOS Medicine, 2008).
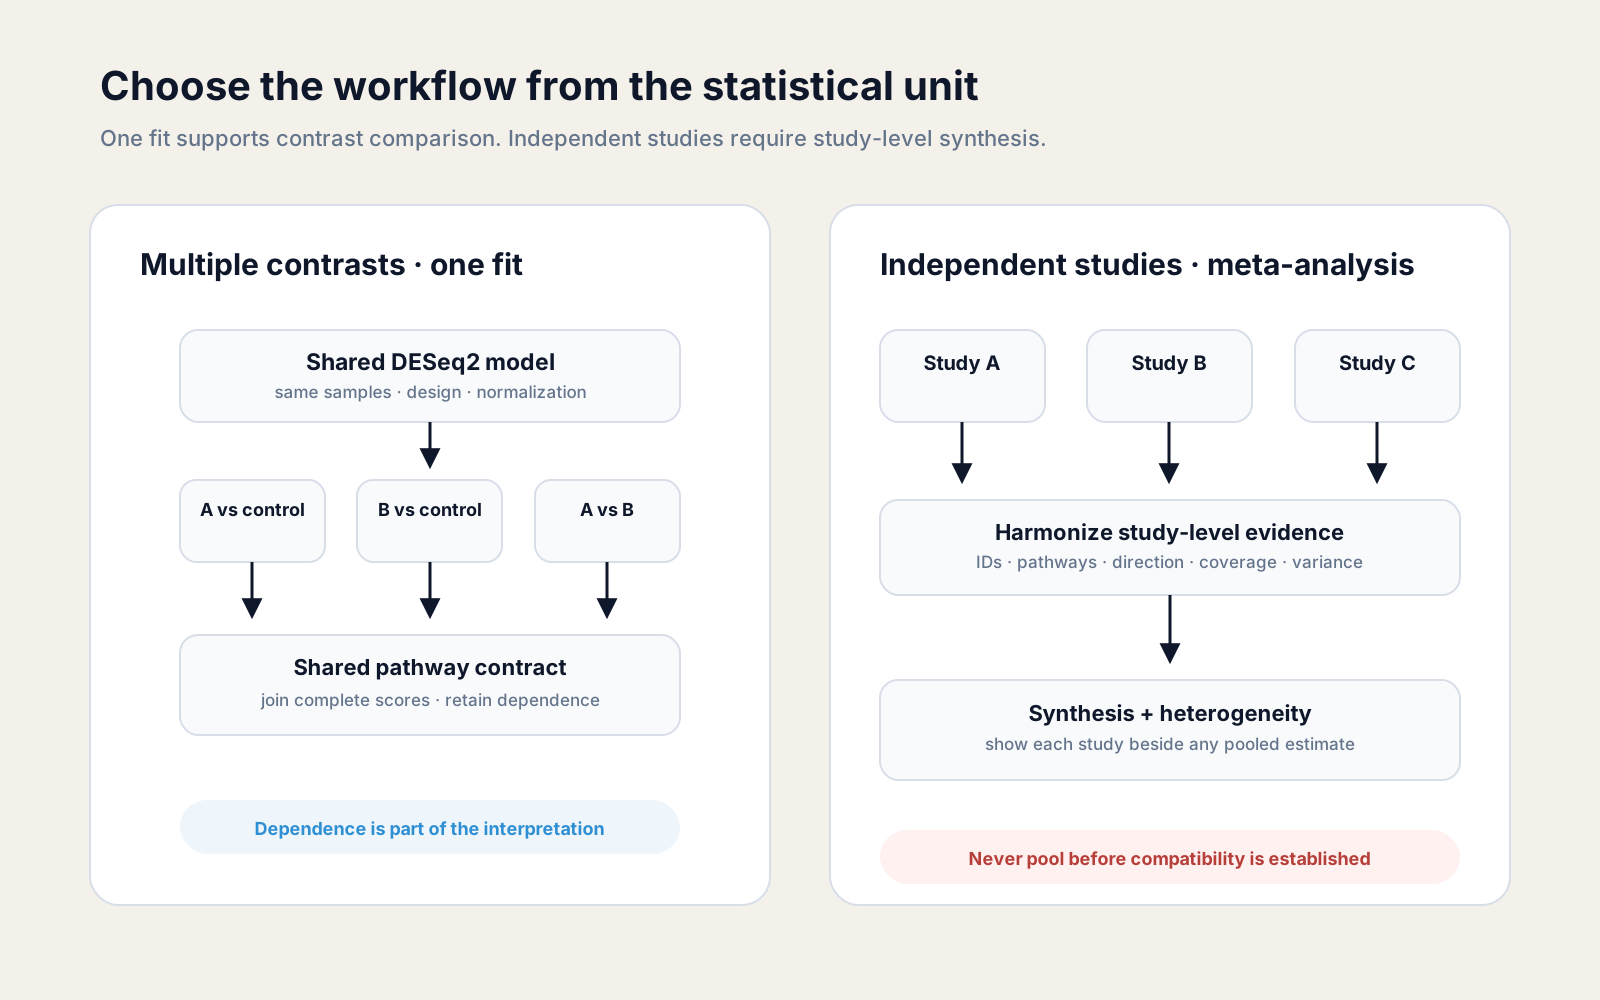
A random-effects model is appropriate when the target is an average effect across heterogeneous studies and an effect estimate with variance is available. With few studies, heterogeneity estimates are unstable, so report the studies individually beside any pooled estimate.
The input to a random-effects synthesis is one estimate and variance per study for the same target quantity. It is not a matrix of normalized counts and not a set of pathway FDR values.
For each pathway, verify that positive means the same biological direction in every study. Estimate heterogeneity, calculate study weights, and retain the per-study rows used in the pooled result.
If a method returns only a rank or enrichment score with no defensible sampling variance, do not invent one. Use rank aggregation, sign consistency, or p-value combination with a clearly stated null, then present that output as a different evidence type.
How should batch and platform differences be handled?
Model batch within a study when it is not confounded with biology; compare platforms through study-level effects, ranks, or standardized summaries rather than raw intensity or count values.
RNA-seq counts, TPM, microarray intensities, and proteomic abundances do not share a numeric scale. Quantile normalization or z-scoring cannot make their measurement processes identical.
For cross-platform work, calculate a comparable within-study statistic first. Options include signed test statistics, ranks, standardized mean differences, or pathway scores explicitly designed for sample-level comparison.
Then test robustness across choices. Does sign agreement persist when low-coverage pathways are removed? Does the result survive a leave-one-study-out analysis? Are conclusions driven by one platform or cohort?
Batch correction is not a license to erase study identity. If platform, disease status, or treatment is perfectly confounded, no correction algorithm can reconstruct the missing comparison.
Can pathways be compared across species?
Yes, but the comparison must be orthologue-aware and pathway-level agreement should not be presented as gene-level identity.
Ensembl Compara distinguishes one-to-one, one-to-many, and many-to-many orthologues. Only the one-to-one case supports a simple feature substitution.
For one-to-many mappings, predeclare whether to keep all orthologues, select a high-confidence representative, or aggregate them. Each choice changes the pathway’s measured membership and can change its score.
Reactome curates human pathways and computationally infers many model-organism events from orthology. Its inferred-event documentation makes the provenance explicit, and its species comparison view marks where inference was or was not possible.
Use species-specific gene sets when available. If translating a human collection, report the source species, target species, orthology release, mapping cardinality, lost members, duplicated members, and final tested size.
A conserved directional pathway pattern is evidence of a shared transcriptional program under the tested definitions. It does not prove identical pathway wiring, cell composition, or phenotypic consequence across species.
Which visualizations reveal agreement and conflict?
Use a score scatter for pairwise agreement, a pathway-by-dataset matrix for many comparisons, and per-study forest plots when estimates have uncertainty.
The score scatter should show zero lines and concordant versus discordant quadrants. Label large sign conflicts, not merely the smallest FDR values.
For three or more datasets, use a matrix with a common directional scale. Encode FDR through opacity or a separate symbol rather than mixing effect and significance into one undocumented color.
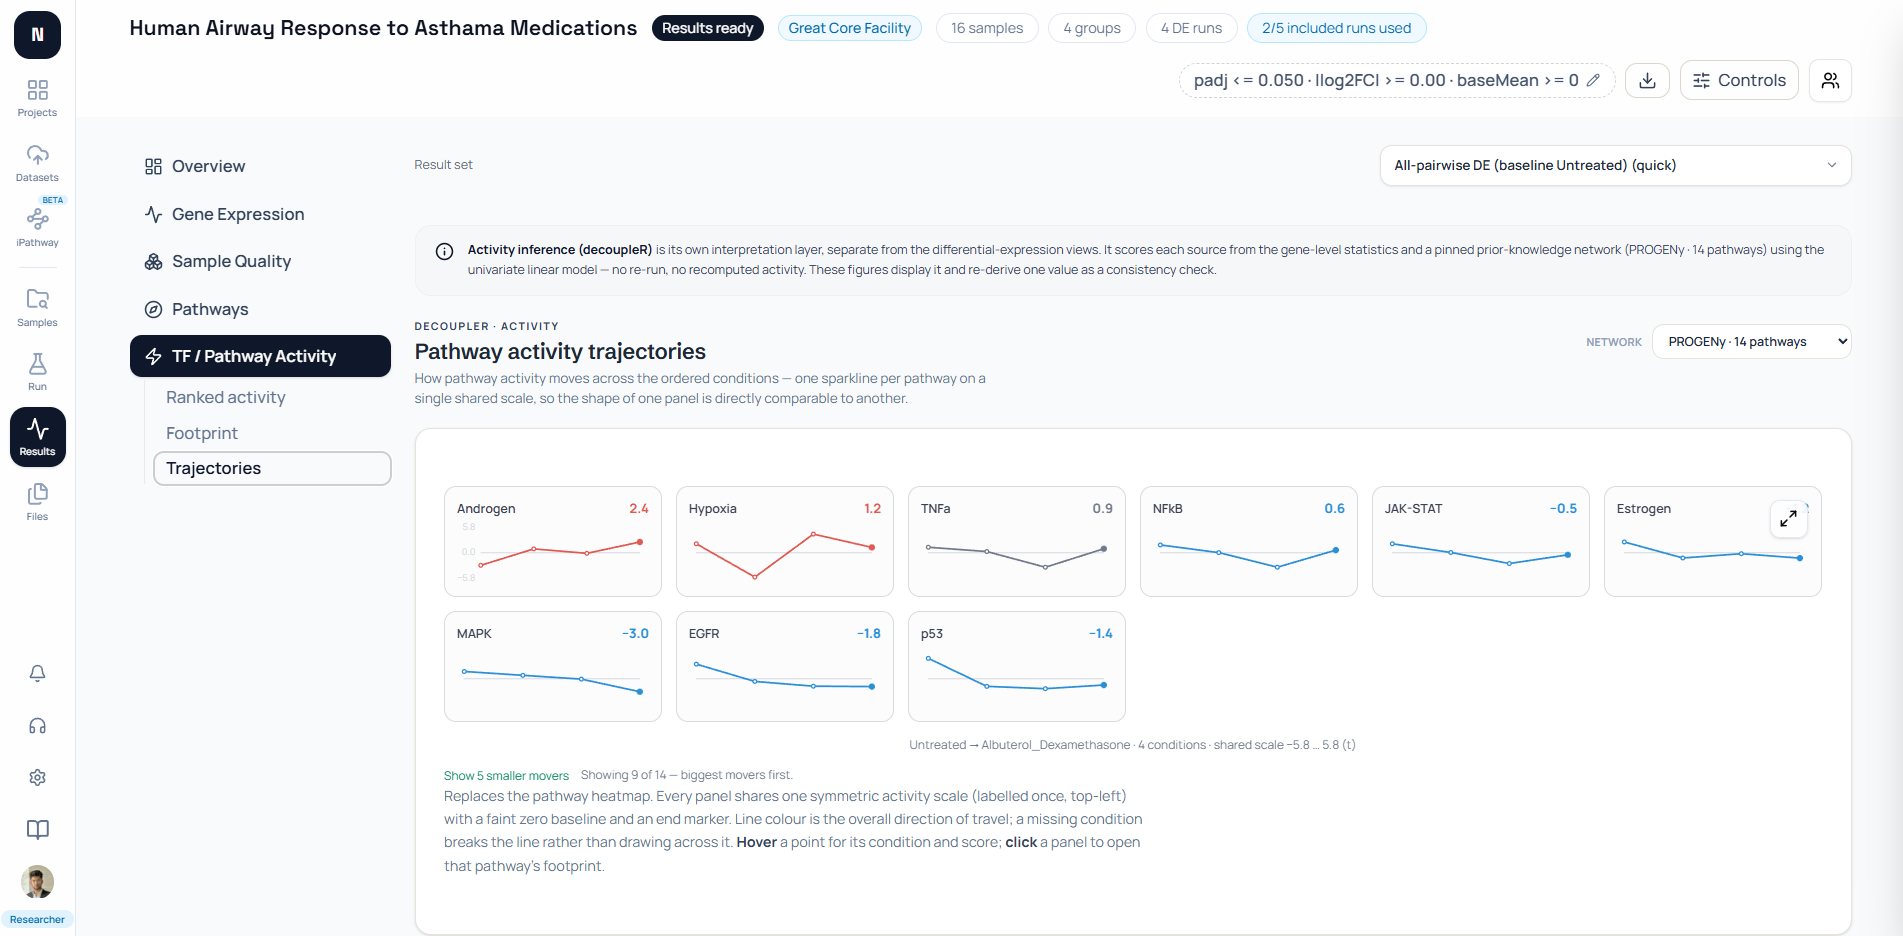
Trajectory plots help when conditions have a meaningful order. Every panel must share one y-scale, and missing values should break the line instead of being interpolated.
Forest plots are best for formal synthesis because they show each study’s estimate, interval, weight, pooled effect, and heterogeneity. A heatmap alone cannot communicate estimation precision.
How does NotchBio compare conditions in one result set?
NotchBio coordinates one selected contrast, gene-set library, gene-level cutoff, and pathway FDR across its pathway workspace; it does not claim cross-study meta-analysis.
The run configuration builds an additive formula from blocking variables plus the primary variable. The backend fits DESeq2 once and extracts explicit pairwise contrasts with results(dds, contrast=...).
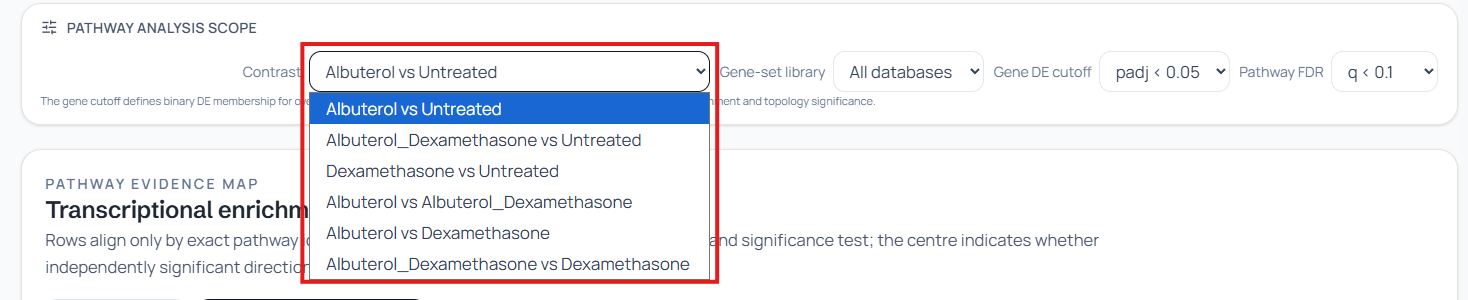
The multi-contrast differential-expression table keeps each gene’s fold change and FDR under separate contrast headers. That is the gene-level substrate for examining whether pathway members move consistently across treatments.
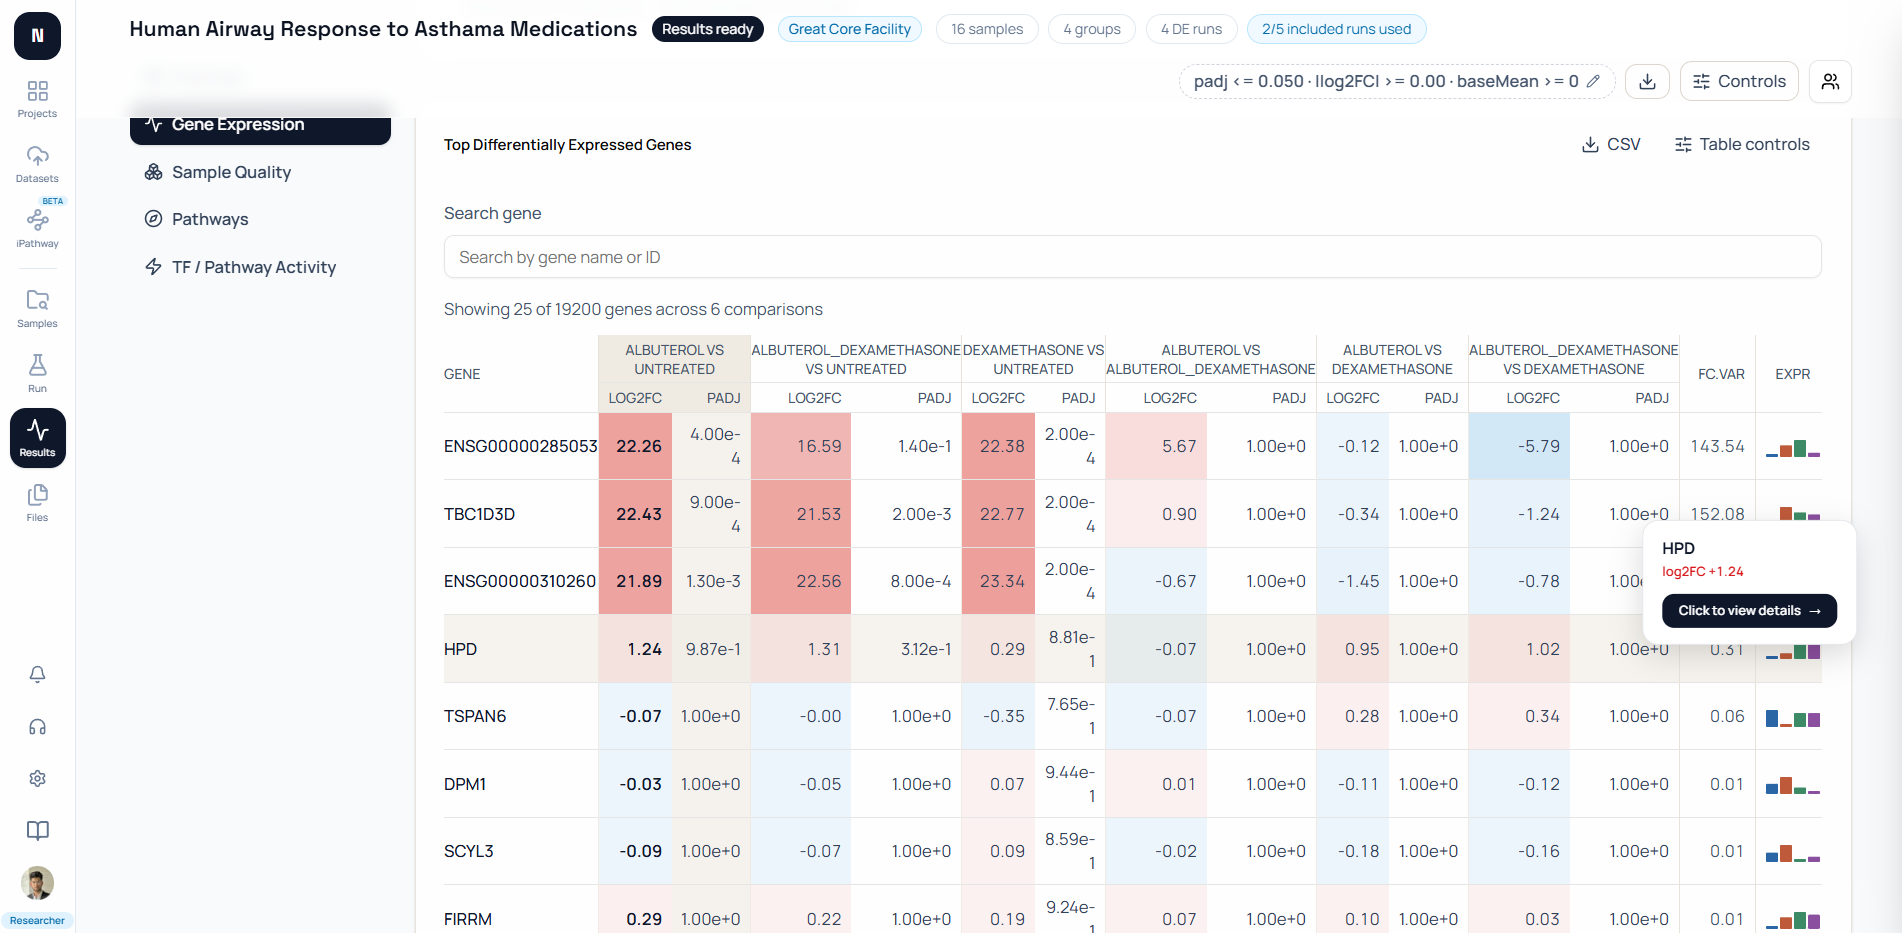
The PROGENy activity view can show ordered conditions on one symmetric scale. The product deliberately breaks a line at missing values and labels the condition order, which prevents unavailable evidence from looking like continuity.
For enrichment mechanics and ranked-list interpretation, continue with the pathway enrichment tutorial and GSEA explainer.
When is a meta-analysis required?
A meta-analysis is required when the claim concerns a combined effect across independent studies rather than visual consistency among separate results.
Use it when studies estimate the same biological contrast, provide compatible effect definitions, and differ enough that a single pooled matrix would be misleading. Predefine inclusion criteria and the pathway contract before seeing which results agree.
Do not pool enrichment scores merely because their column names match. Confirm the score’s scale, null model, direction, set-size handling, and variance. If no defensible variance exists, present a structured concordance analysis instead of a pseudo-precise pooled estimate.
Report each study, the pooled result if justified, heterogeneity, sensitivity analysis, mapping coverage, and pathway version. A pathway that reverses direction across studies needs biological or design investigation, not an averaged label.
For the network definitions behind shared-pathway structure, return to How Are Biological Pathways Connected?.
The next step is to build figures that preserve these distinctions. Pathway Visualization in Python turns the tidy comparison contract into matrices, score scatters, networks, and export-ready graphics.
Further reading
Read another related post
Bulk RNA-Seq Pipeline: FASTQ to Gene Counts Step by Step
Every computational step in bulk RNA-seq, explained: from FASTQ quality control through trimming, alignment, and quantification to your final count matrix.
Research GuideWhat Are Batch Effects in RNA-Seq? Causes and Examples
What batch effects are, why they happen in bulk RNA-seq, and how they quietly corrupt your differential expression results — the concepts to grasp first.
Research GuideCell Line Pathway Analysis: Methods and Comparisons
Choose valid RNA-seq designs for pathway comparisons across cell lines, including additive adjustment, stratified effects, and treatment-by-cell-line interactions.