FASTQ Quality Control with FastQC, fastp, and MultiQC
Every bulk RNA-seq pipeline starts the same way. You have your FASTQ files. You are impatient to align them. And the temptation is to skip quality control and go straight to Salmon.
Do not do that.
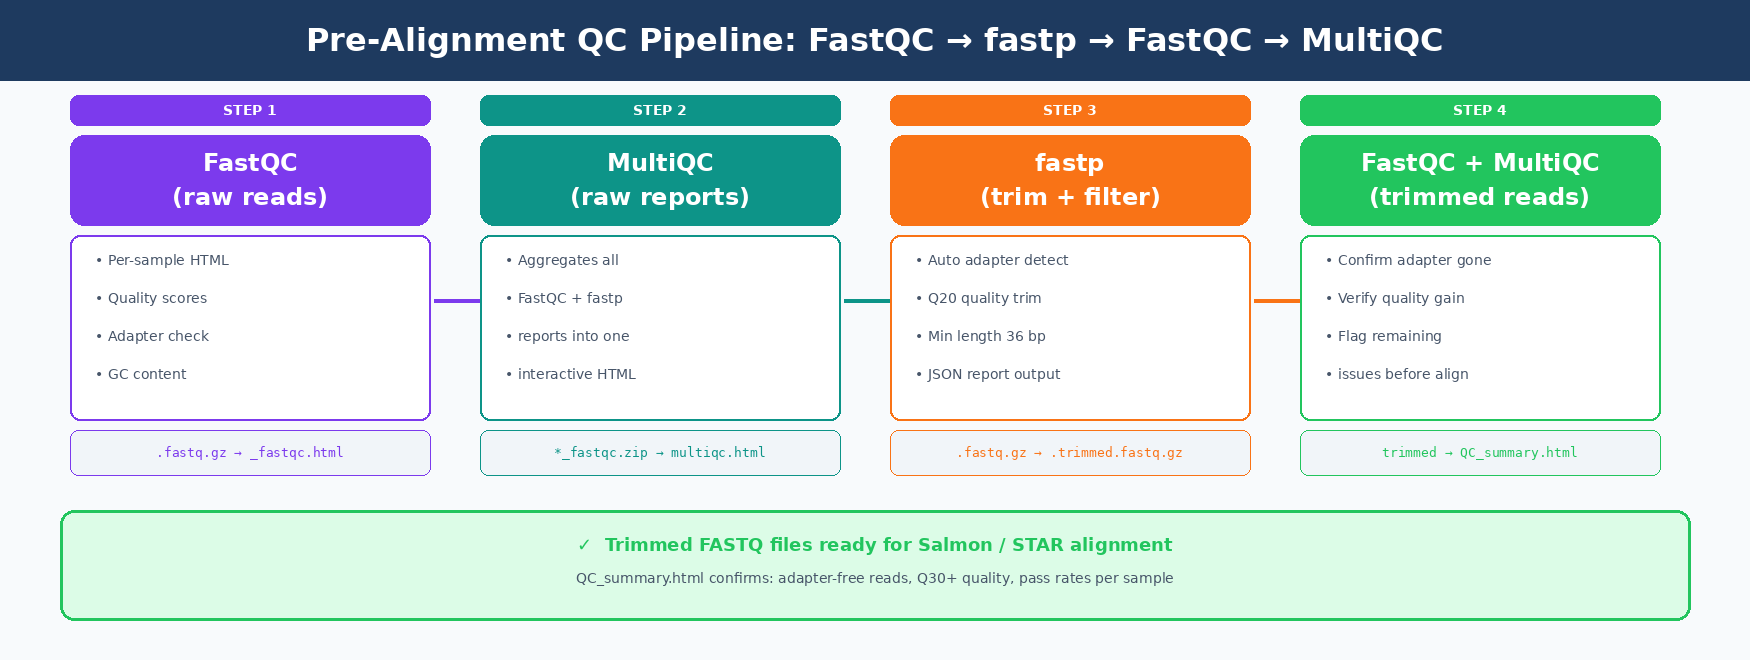
Bad reads produce bad counts. Bad counts produce bad differential expression results. FastQC catches problems before they become errors you cannot explain in your results section. This post walks through the complete pre-alignment QC pipeline: FastQC on raw reads, trimming with fastp, re-running FastQC on trimmed reads, and aggregating everything into a single MultiQC report.
We use the rnaseq conda environment from the Ubuntu and macOS setup guide and the downloaded FASTQ files from the GEO and SRA download tutorial.
How to Set Up Your Project Directory for QC
A clean directory structure makes the pipeline easier to write and easier to re-run. Set this up once at the start of every project.
# Create the full project structuremkdir -p rnaseq_project/{data/raw,results/{fastqc_raw,fastqc_trimmed,trimmed,multiqc}}
cd rnaseq_project
# Verify the layouttree -d .# .# ├── data/# │   └── raw/         ← your FASTQ files from the GEO/SRA download step go here# └── results/#     ├── fastqc_raw/  ← FastQC reports on raw reads#     ├── fastqc_trimmed/  ← FastQC reports after trimming#     ├── trimmed/     ← fastp output FASTQ files#     └── multiqc/     ← aggregated reports
If you already have FASTQ files in a different location, update the paths in the scripts below. Do not move the files themselves.
Activate your environment first.
conda activate rnaseqfastqc --version # FastQC v0.12.1fastp --version # fastp 0.24.0multiqc --version # multiqc, version 1.25.1How to Run FastQC on Raw RNA-Seq Reads
FastQC reads each FASTQ file and produces an HTML report per sample. Run it on both R1 and R2 for paired-end data.
Single sample (testing)
fastqc data/raw/SRR26891234_1.fastq.gz \       data/raw/SRR26891234_2.fastq.gz \       --outdir results/fastqc_raw/ \       --threads 4
# Output:# results/fastqc_raw/SRR26891234_1_fastqc.html# results/fastqc_raw/SRR26891234_1_fastqc.zip# results/fastqc_raw/SRR26891234_2_fastqc.html# results/fastqc_raw/SRR26891234_2_fastqc.zip
All samples in parallel
For a full experiment, loop over all FASTQ files and run them in parallel. GNU parallel is already in the environment.
# Run FastQC on all raw FASTQ files using 4 parallel jobs# Each job uses 4 threads, so total CPU usage is 4 x 4 = 16
ls data/raw/*.fastq.gz | \    parallel -j 4 \    fastqc {} --outdir results/fastqc_raw/ --threads 4
echo "FastQC on raw reads complete."echo "Reports saved to results/fastqc_raw/"
This typically takes 2-10 minutes for 12 samples depending on file size. Open any HTML file in your browser to see the first set of results before moving to trimming.
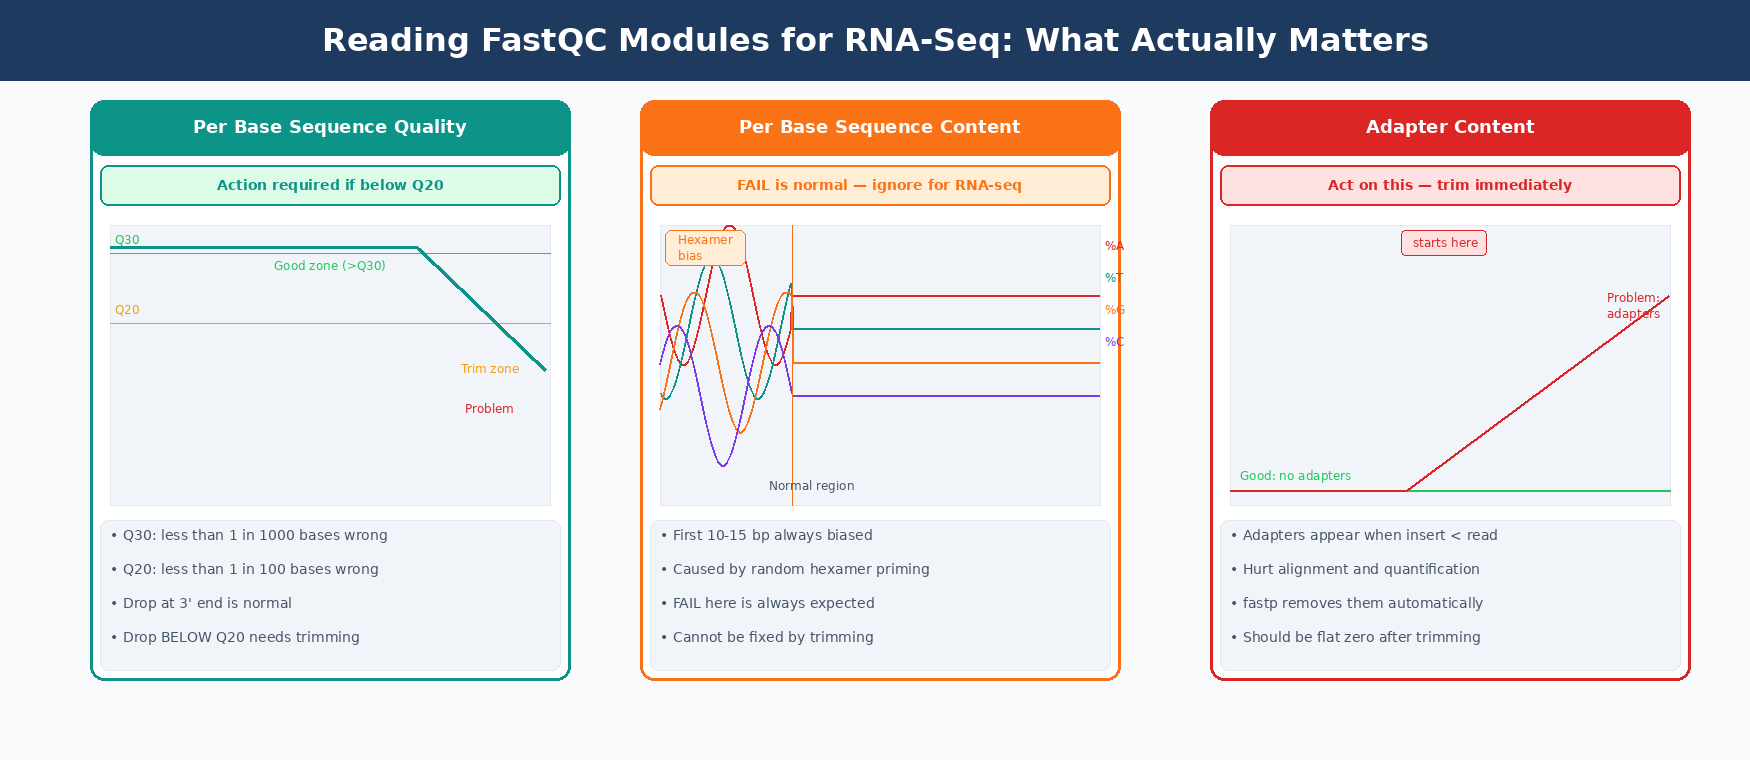
FastQC thresholds are designed for WGS, not RNA-seq
FastQC flags are calibrated for whole-genome shotgun DNA sequencing. Several modules will show WARN or FAIL on perfectly healthy RNA-seq data. The thresholds used to assign these flags are based on a very specific type of sequence data and are less reliable with RNA-seq. WARN and FAIL flags mean stop and consider what the result means in context, not that something is necessarily broken.
How to Interpret FastQC Reports for RNA-Seq Data
This is where most people get confused. RNA-seq data behaves differently from DNA-seq data, and FastQC is not always aware of that.
The table below shows which flags to treat as problems versus which are expected and normal for RNA-seq.
| FastQC Module | What FAIL / WARN Means for RNA-Seq | Action |
|---|---|---|
| Per base sequence quality | Real quality drop. Bases below Q20 at the 3’ end are low quality. | Trim with fastp |
| Per base sequence content | FAIL is normal. First 10-15 bp always show hexamer priming bias. | Ignore, no fix needed |
| Per sequence GC content | WARN is often normal. Unequal transcript abundance skews GC curve. | Investigate only if double-peaked |
| Sequence duplication levels | FAIL is normal. Highly expressed genes produce many identical reads. | Ignore for RNA-seq |
| Adapter content | Always act on this. Adapters hurt alignment and quantification. | Trim with fastp |
| Overrepresented sequences | Check what the sequence is. Could be rRNA or adapter dimer. | Investigate; rRNA needs upstream depletion |
| Per tile sequence quality | Real problem. A bad sequencing tile affects all samples. | Contact sequencing facility |
| Sequence length distribution | WARN if reads are variable length post-trimming. | Normal after trimming |
The three flags that actually matter
Per base sequence quality dropping below Q20 in the last 10-20 bases is the most common real problem. Reads drop in quality toward the 3’ end during sequencing. fastp fixes this with quality trimming.
Adapter content appearing at any position means adapters made it into your library. This happens when the cDNA insert is shorter than the read length. fastp auto-detects and removes them.
Overrepresented sequences that match rRNA are a library prep problem. No amount of trimming fixes rRNA contamination. It means the depletion or poly-A selection step failed, and the data should be flagged.
How to Trim Adapters and Low-Quality Reads with fastp
fastp is faster than Trimmomatic, auto-detects adapters without specifying adapter sequences manually, and produces per-sample JSON reports that MultiQC can read directly.
Single sample
fastp \ --in1 data/raw/SRR26891234_1.fastq.gz \ --in2 data/raw/SRR26891234_2.fastq.gz \ --out1 results/trimmed/SRR26891234_1.trimmed.fastq.gz \ --out2 results/trimmed/SRR26891234_2.trimmed.fastq.gz \ --html results/fastqc_raw/SRR26891234_fastp.html \ --json results/fastqc_raw/SRR26891234_fastp.json \ --detect_adapter_for_pe \ --qualified_quality_phred 20 \ --length_required 36 \ --thread 4 \ 2>> logs/fastp.logWhat each flag does
--detect_adapter_for_pe auto-detects adapter sequences for paired-end data. No need to specify TruSeq or Nextera adapter sequences manually.
--qualified_quality_phred 20 sets the base quality threshold. Bases with Phred score below 20 (1% error rate) are trimmed from the 3’ end.
--length_required 36 discards reads shorter than 36 bp after trimming. Reads shorter than this do not align reliably to a mammalian genome.
--thread 4 uses 4 CPU threads. fastp scales well up to 16 threads.
All samples in a loop
#!/bin/bash# trim_all.sh: run fastp on all paired-end samples
set -euo pipefailmkdir -p results/trimmed logs
OUTDIR_TRIMMED="results/trimmed"OUTDIR_REPORTS="results/fastqc_raw"
for R1 in data/raw/*_1.fastq.gz; do    # Derive sample name and R2 path    sample=$(basename "$R1" _1.fastq.gz)    R2="data/raw/${sample}_2.fastq.gz"
    echo "[$(date +%H:%M:%S)] Trimming $sample"
    fastp \        --in1  "$R1" \        --in2  "$R2" \        --out1 "$OUTDIR_TRIMMED/${sample}_1.trimmed.fastq.gz" \        --out2 "$OUTDIR_TRIMMED/${sample}_2.trimmed.fastq.gz" \        --html "$OUTDIR_REPORTS/${sample}_fastp.html" \        --json "$OUTDIR_REPORTS/${sample}_fastp.json" \        --detect_adapter_for_pe \        --qualified_quality_phred 20 \        --length_required 36 \        --thread 4 \        2>> "logs/${sample}_fastp.log"
    echo "[$(date +%H:%M:%S)] Done: $sample"done
echo "Trimming complete. Trimmed reads in $OUTDIR_TRIMMED"
Run it:
bash trim_all.shFor a 12-sample experiment, this takes about 15-30 minutes total running sequentially. fastp prints a summary per sample including how many reads passed, how many were trimmed, and the duplication rate.
Check the fastp log for per-sample pass rates
A healthy RNA-seq library should have 90-98% of reads passing quality filters. If fastp reports that only 60-70% of reads pass, check the raw FastQC report for that sample. You likely have significant adapter content or a large proportion of short inserts.
How to Re-Run FastQC on Trimmed Reads
After trimming, run FastQC again. The goal is to confirm two things: adapter content is gone, and the quality score profile has improved at the 3’ end.
# Run FastQC on all trimmed readsls results/trimmed/*.trimmed.fastq.gz | \    parallel -j 4 \    fastqc {} --outdir results/fastqc_trimmed/ --threads 4
echo "FastQC on trimmed reads complete."
This produces a second set of HTML reports in results/fastqc_trimmed/. You should now see adapter content at zero across all positions, and quality scores staying above Q25-Q30 to the end of reads.
The per-base sequence content FAIL will still be there. That is the hexamer priming bias from library prep and cannot be fixed by trimming. It does not affect quantification.
How to Aggregate All QC Reports with MultiQC
You now have FastQC reports from two rounds of QC (raw and trimmed) plus fastp JSON reports. That is potentially 50+ HTML files for a 12-sample experiment.
MultiQC reads all of them and produces a single interactive HTML report.
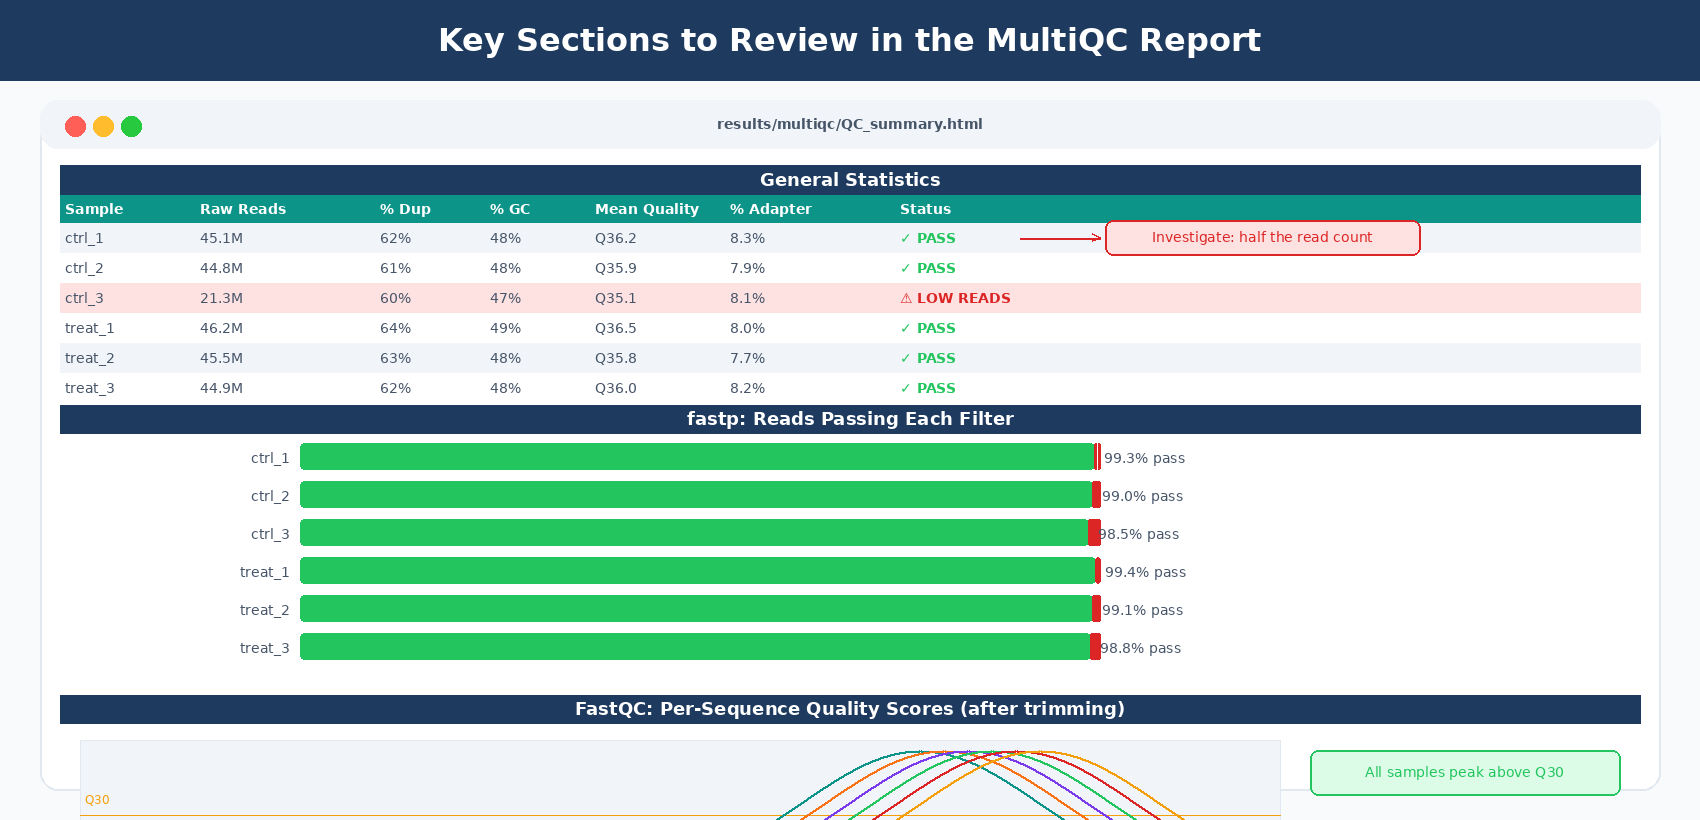
# Run MultiQC across all QC outputs in one passmultiqc \    results/fastqc_raw/ \    results/fastqc_trimmed/ \    --outdir results/multiqc/ \    --filename "QC_summary_report.html" \    --title "RNA-seq QC: raw vs trimmed" \    --comment "Project: GSE253406"
echo "MultiQC report: results/multiqc/QC_summary_report.html"
Open the HTML file in your browser. MultiQC automatically groups metrics by tool and sample and lays everything out in an interactive dashboard.
What to look at in the MultiQC report
General Statistics table. This is the first thing to check. It shows per-sample read counts, % duplicates, %GC, and mean quality. Scan it for any sample that is obviously different from the others. A sample with half the read count is a red flag.
FastQC: Per Sequence Quality Scores. After trimming, all samples should have their peak at Q30 or higher.
FastQC: Adapter Content (trimmed). Should be a flat line at zero across all positions after fastp.
fastp: Filtering Results. Shows how many reads each sample lost to filtering. If one sample lost 30% of reads and others lost only 5%, investigate that sample.
fastp: Insert Size Distribution. Shows the insert size of your library. For most mRNA-seq libraries this peaks at 150-300 bp.
How to Read fastp’s Per-Sample Summary
fastp prints a summary to stderr after each run. Check it for any sample that shows unexpected numbers.
Read1 before filtering:total reads: 45,123,456total bases: 6,768,518,400Q20 bases: 6,683,400,000(98.74%)Q30 bases: 6,421,234,000(94.87%)
Read1 after filtering:total reads: 44,678,123total bases: 6,612,456,789Q20 bases: 6,605,000,000(99.88%)
Filtering result:reads passed filter: 89,312,456 (99.01%)reads failed due to low quality: 234,567 (0.26%)reads failed due to too many N: 45,678 (0.05%)reads failed due to too short: 623,456 (0.69%)
Target numbers for a healthy library:
- Reads passing filter: 95% or above
- Q30 before filtering: 85% or above for NovaSeq, 80% or above for older instruments
- Reads too short (lost to length cutoff): under 2%
If any sample falls outside these ranges, record it in your QC notes and flag it for closer review.
Do not remove duplicate reads from RNA-seq data
Some pipelines include a deduplication step that removes PCR duplicates. Do not do this for bulk RNA-seq. Highly expressed genes will legitimately produce many identical reads. Deduplication discards real signal. It is appropriate for ATAC-seq, ChIP-seq, and some single-cell workflows, but not for measuring transcript abundance.
A Complete One-Script QC Pipeline
Here is everything from this post in a single runnable script.
#!/bin/bash# Full pre-alignment QC: FastQC → fastp → FastQC → MultiQC
set -euo pipefail
RAWDIR="data/raw"TRIMDIR="results/trimmed"FQRAW="results/fastqc_raw"FQTRIM="results/fastqc_trimmed"MQDIR="results/multiqc"LOGDIR="logs"
mkdir -p "$TRIMDIR" "$FQRAW" "$FQTRIM" "$MQDIR" "$LOGDIR"
echo "=== STEP 1: FastQC on raw reads ==="ls "$RAWDIR"/*.fastq.gz | \    parallel -j 4 fastqc {} --outdir "$FQRAW" --threads 4echo "FastQC raw: done"
echo "=== STEP 2: fastp trimming ==="for R1 in "$RAWDIR"/*_1.fastq.gz; do    sample=$(basename "$R1" _1.fastq.gz)    R2="$RAWDIR/${sample}_2.fastq.gz"
    fastp \        --in1  "$R1" --in2  "$R2" \        --out1 "$TRIMDIR/${sample}_1.trimmed.fastq.gz" \        --out2 "$TRIMDIR/${sample}_2.trimmed.fastq.gz" \        --html "$FQRAW/${sample}_fastp.html" \        --json "$FQRAW/${sample}_fastp.json" \        --detect_adapter_for_pe \        --qualified_quality_phred 20 \        --length_required 36 \        --thread 4 \        2>> "$LOGDIR/${sample}_fastp.log"doneecho "fastp trimming: done"
echo "=== STEP 3: FastQC on trimmed reads ==="ls "$TRIMDIR"/*.fastq.gz | \    parallel -j 4 fastqc {} --outdir "$FQTRIM" --threads 4echo "FastQC trimmed: done"
echo "=== STEP 4: MultiQC ==="multiqc "$FQRAW" "$FQTRIM" \    --outdir "$MQDIR" \    --filename "QC_summary.html" \    --title "RNA-seq QC Report"echo "MultiQC report: $MQDIR/QC_summary.html"
echo "=== QC pipeline complete ==="echo "Trimmed reads ready for alignment in: $TRIMDIR"
Run the entire pipeline with one command:
bash rna_seq_qc_pipeline.shCheck the MultiQC report at results/multiqc/QC_summary.html, flag any problem samples, and then proceed to Salmon quantification.
Manual QC Pipeline vs NotchBio: QC on Every Upload
This pipeline is reproducible and solid. But it requires four tools, two rounds of FastQC, a batch script, and about an hour of wall time for a 12-sample dataset.
NotchBio runs FastQC, fastp, and MultiQC automatically every time you upload reads. The QC report is in the browser before you finish your coffee.
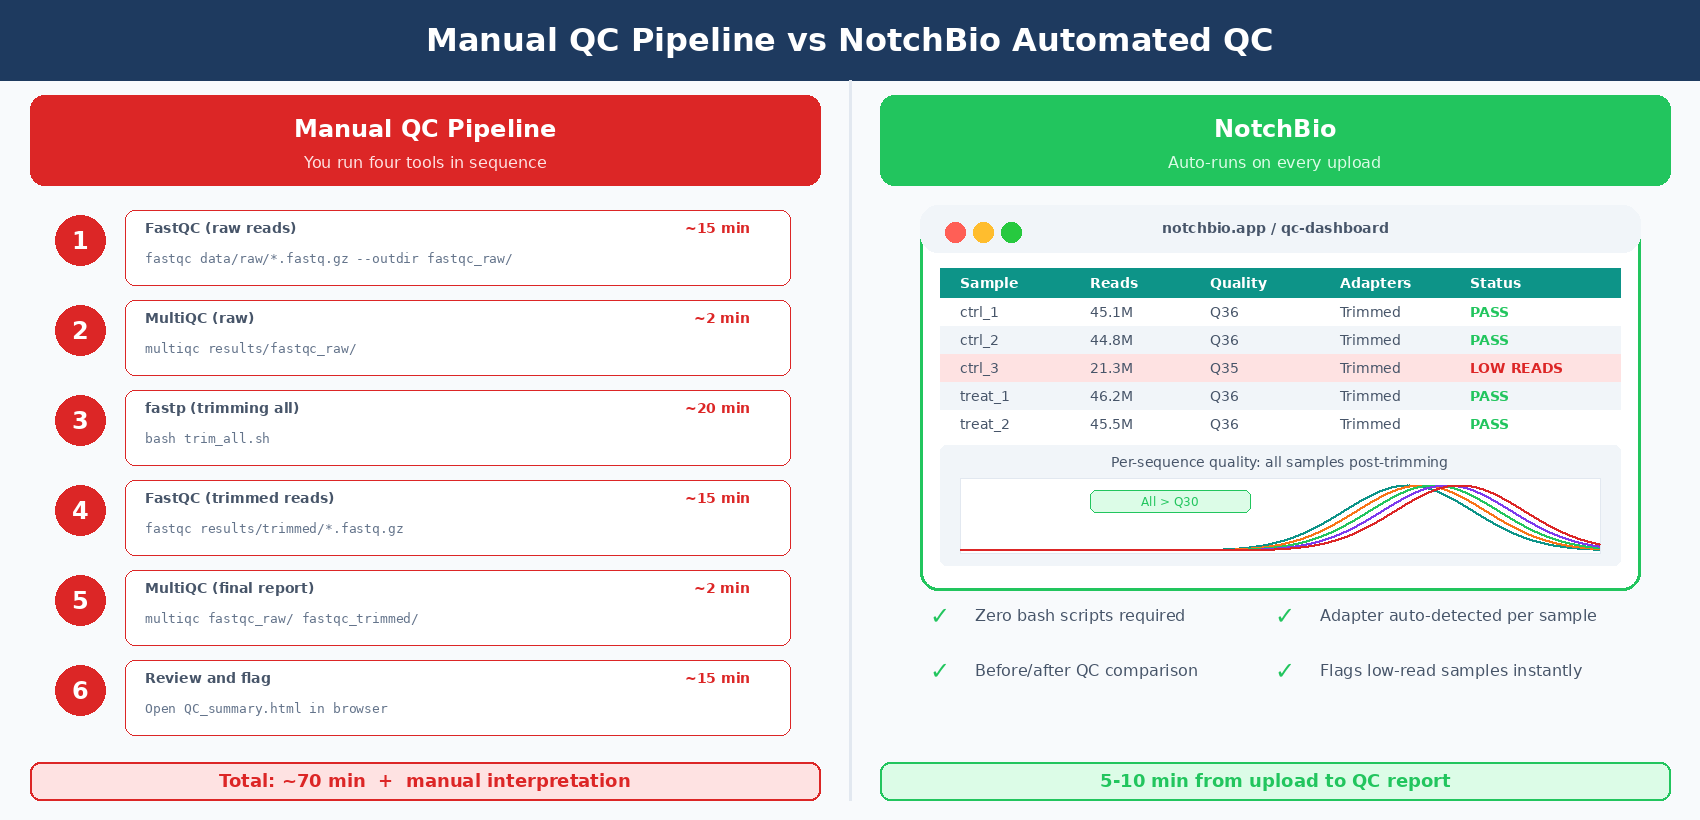
| Step | Manual Pipeline | NotchBio |
|---|---|---|
| Raw FastQC | fastqc in a parallel loop | Auto-runs on upload |
| Report aggregation | multiqc results/fastqc_raw/ | Shown in the dashboard |
| Adapter detection | --detect_adapter_for_pe in fastp | Auto-detected per sample |
| Trimming | bash loop over all samples | Auto, per-sample |
| Post-trim FastQC | Second fastqc loop | Auto, before/after comparison |
| Flagging bad samples | Manual inspection of MultiQC table | Highlighted in the QC dashboard |
| Time to MultiQC report | 45-90 min for 12 samples | 5-10 min after upload |
| Setup required | conda environment from the setup guide | Log in and upload |
| Custom per-project parameters | Edit bash script | Adjustable in the UI |
| Good for | Custom pipelines, HPC, reproducibility | Fast QC on any machine |
If you want the same QC results without setting up a shell environment, notchbio.app runs FastQC, fastp, and MultiQC automatically on every uploaded dataset.
Further reading
Read another related post
From Salmon Output to DEGs in Python with PyDESeq2
A pipeline-focused PyDESeq2 tutorial: load Salmon quant.sf into a count matrix, fit a DeseqDataSet, run Wald tests, apply apeGLM shrinkage, export DEGs. No R.
TutorialHow to Run DESeq2 in R: From Salmon Counts to DEG Results
DESeq2 in R from Salmon counts: import quant.sf with tximeta, build a DESeqDataSet, run the Wald test, apply apeglm shrinkage, and export a ranked DEG table.
TutorialBuild a Counts Matrix from featureCounts and Salmon
Python tutorial: parse featureCounts output, aggregate Salmon quant.sf, build a tx2gene map, and save a DESeq2-ready integer count matrix with pandas.