What FastQC Reports Actually Tell You (And What Beginners Miss)
A researcher joined a lab, ran the full RNA-seq pipeline from scratch in two weeks, got a clean-looking volcano plot, and then spent an hour getting interrogated by her PI about every parameter she had set. She stumbled, forgot a piece of her code, and eventually cried. The PI, it turned out, was not being cruel. He was pointing at something specific: she had run FastQC and looked at each report, but she had not looked at the QC report the sequencing company had delivered with the raw data. They told different stories.
That scenario is not unusual. FastQC is one of the first tools every bioinformatics course teaches, which means most people learn to run it without learning to read it. They see a grid of green checks, feel reassured, and move on. The problems are almost always hiding in the sections that did not turn red.
This post is about those sections. It is also about a second report that an alarming number of people never open.
The Report You Forgot To Read
When you send samples to a commercial sequencing facility, you get two things back: your FASTQ files and a QC report the facility generated before they shipped the data. That report reflects what the sequencing instrument measured about your libraries, often including metrics your own FastQC run cannot see: cluster density, Q30 scores at the flow cell level, PhiX alignment rates, and sometimes index-swapping rates if the run was multiplexed.
I have seen researchers skip this document entirely, run their own FastQC, get greens across the board, and miss the fact that one of their samples had a cluster density so high the instrument was overcalling bases. FastQC on the reads themselves looked acceptable. The facility report flagged it clearly.
Read the facility report first. Before you run a single tool. If anything in it contradicts what you later see in FastQC, the facility report is the ground truth.
Check the facility QC report before running FastQC
Sequencing facilities generate a QC report at the instrument level that captures metrics FastQC cannot: cluster density, Q30 across the flow cell, and index-swapping rates. Open this document before your own analysis begins. A sample can look acceptable in FastQC and still be flagged as problematic at the facility level.
Per Base Sequence Quality: What Green Actually Means
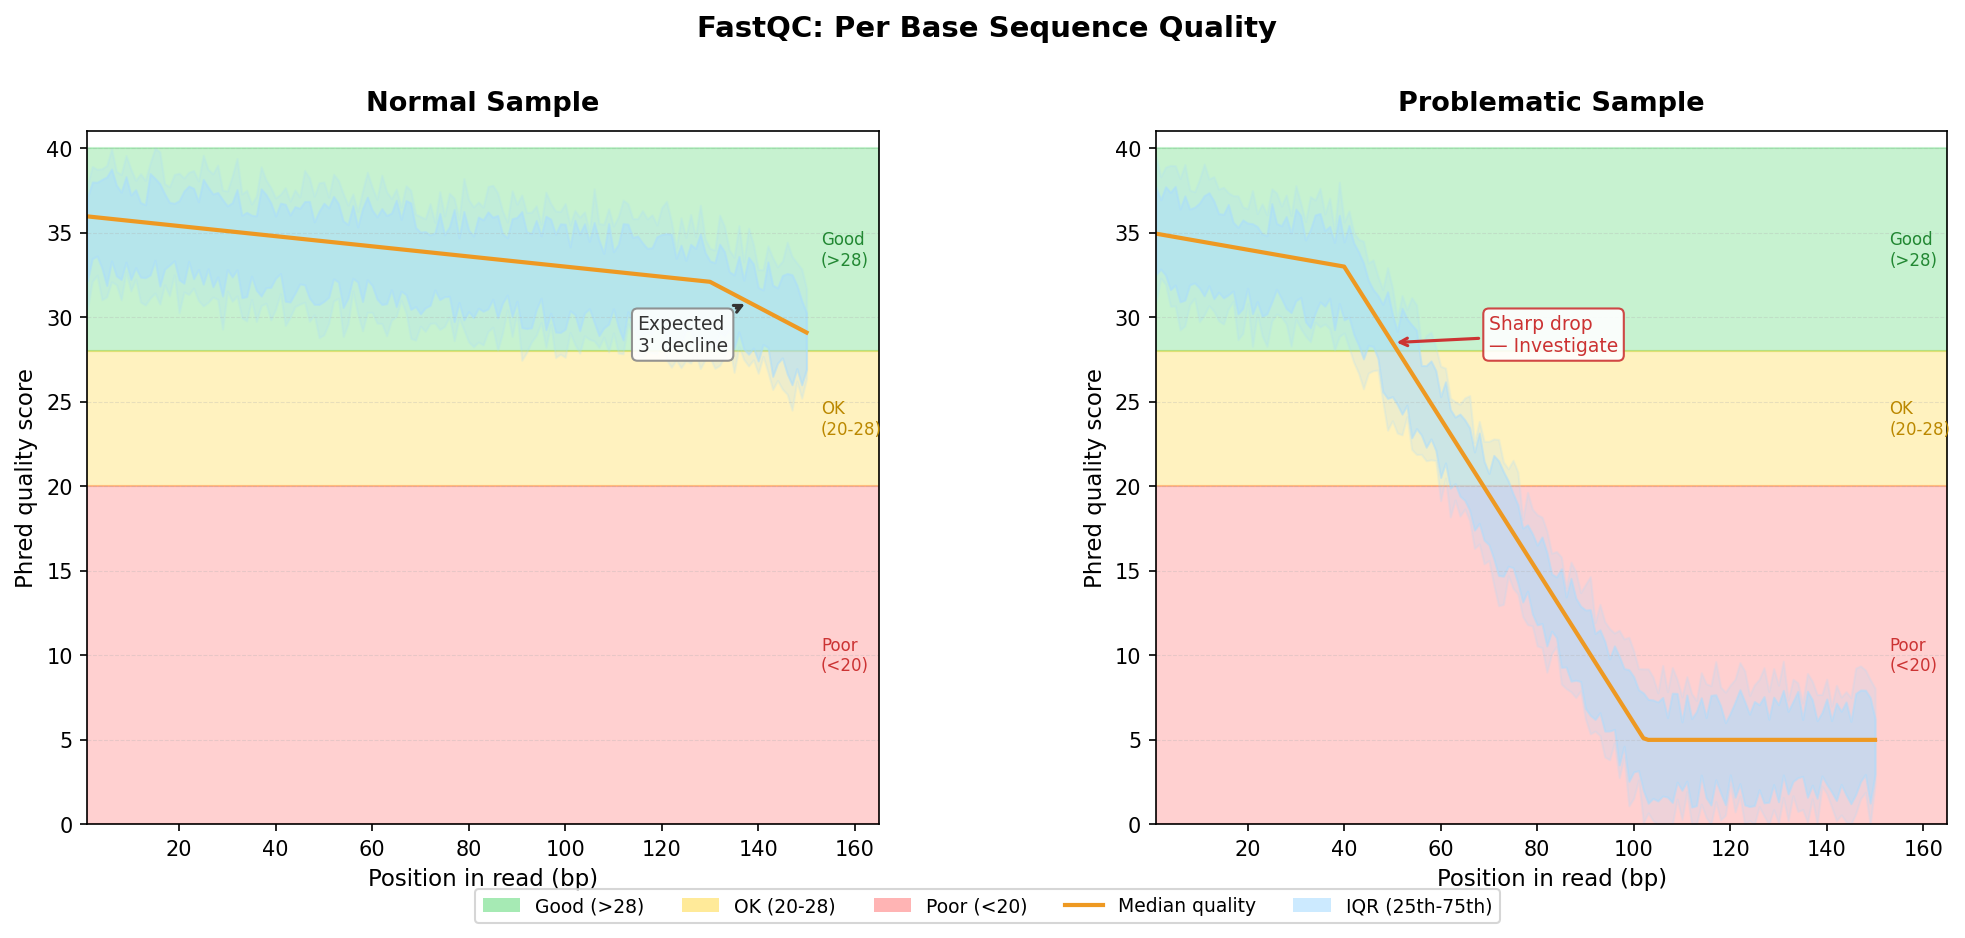
The per-base sequence quality plot is the one everyone knows. Bases are colored green if median quality is above 28, orange between 20 and 28, and red below 20. The standard advice is: green is good, red is bad.
That framing is not wrong, but it is incomplete.
Quality scores in Illumina sequencing drop toward the 3’ end of reads. This is not a failure; it is physics. The fluorescent signal degrades over the length of the sequencing cycle, so position 150 of a 150bp read will almost always be noisier than position 10. A well-sequenced sample will show a mild downward slope at the right end of the plot. That slope is expected. What is not expected is a sharp drop starting at position 30, or a sudden oscillating pattern at any position.
The oscillating pattern is the one to pay attention to. If the quality scores rise and fall in a regular wave across the read length, you are looking at a calibration artifact or a tile-level issue on the flow cell. FastQC will usually not flag this as a failure, but it is a warning sign worth investigating.
When the 3’ drop is severe, the practical response is trimming, not panic. Tools like fastp or Trimmomatic will clean the low-quality bases off the end of each read. The question to ask before you trim is: how much of the read will be left? If you are working with 50bp reads and quality drops sharply at position 35, you will be working with very short reads after trimming, which affects mapping rates and quantification accuracy.
Adapter Content: The Contamination That Quietly Breaks Alignment
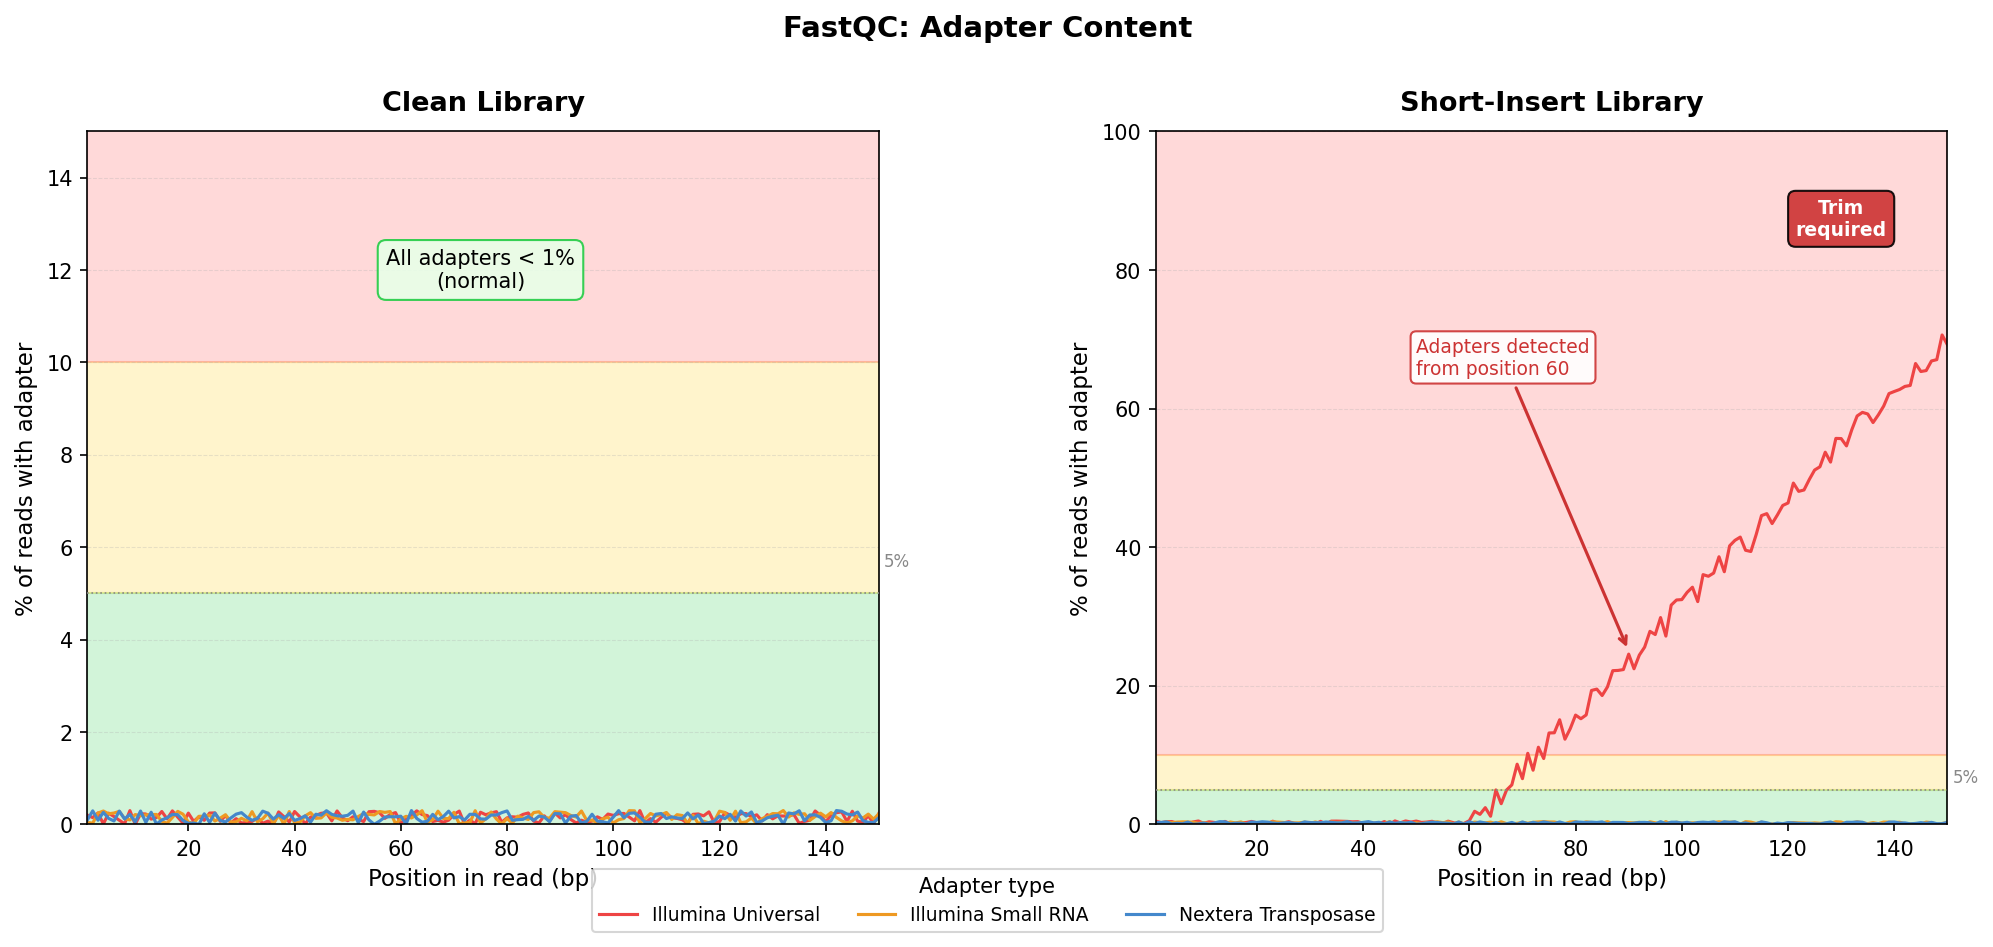
The adapter content module shows what fraction of reads contain Illumina adapter sequence at each position in the read. A clean library shows near-zero adapter content across all positions. A library with short inserts shows adapter content rising toward the 3’ end, sometimes reaching 80 percent or more.
FastQC flags adapter content as a warning at 5 percent and a failure at 10 percent. Those thresholds are conservative, and in RNA-seq you will routinely see levels that trigger warnings even in good libraries. The important question is not whether the warning fired; it is whether the adapter content will affect your downstream analysis.
The critical scenario is short-fragment libraries. If you sequenced miRNA or degraded RNA, many fragments will be shorter than the read length, which means the sequencer reads past the end of the insert and into the adapter. Alignment tools like STAR are designed to handle mismatched bases at read ends, but they will struggle if a large fraction of each read is adapter sequence. Trimming is mandatory before alignment in that case.
For standard poly(A)-selected RNA-seq from intact RNA, moderate adapter content at the 3’ tail is common and manageable. The aligner will soft-clip those bases. But if adapter content rises sharply before position 50 in a 150bp library, you have a library preparation problem that trimming cannot fully fix. It points to short-fragment enrichment or adapter dimer contamination.
Sequence Duplication Levels: When High Is Fine
This is the module that causes the most unnecessary alarm among beginners.
Sequence duplication levels measure what fraction of your reads appear more than once in the library. FastQC flags this as a failure when more than 50 percent of reads are duplicated. In whole-genome sequencing, high duplication is a real problem: it suggests you amplified too few library molecules and your sequencing depth is wasted. But RNA-seq is different.
In RNA-seq, highly expressed genes produce many reads from the same transcript. A gene making up 10 percent of total transcription in your sample will naturally produce many nearly-identical reads, not because of PCR over-amplification, but because the biology. FastQC cannot distinguish biological duplication from technical duplication. It sees identical sequences and marks them as duplicates regardless of origin.
I have seen perfectly healthy RNA-seq libraries from highly proliferative cell lines where 60 to 70 percent of reads were flagged as duplicates. The downstream DGE results were clean, the mapping rates were high, and the PCA plots separated conditions clearly. The duplication warning was noise.
The relevant question is not whether duplication is high in absolute terms. It is whether duplication is unexpectedly high given your library type. A low-input library from FACS-sorted cells with very few starting molecules should have low duplication; if it does not, your PCR cycles may be excessive. A bulk RNA-seq library from a standard cell line with 1 microgram of input RNA can look highly duplicated and still be fine.
High sequence duplication in RNA-seq is usually fine
Unlike whole-genome sequencing, high duplication in RNA-seq often reflects genuine biological signal from highly expressed genes. Do not remove duplicates before running DESeq2 or edgeR unless you have a specific reason to believe your duplication is technical, not biological. Most standard bulk RNA-seq workflows skip deduplication entirely.
Overrepresented Sequences: The rRNA Tell
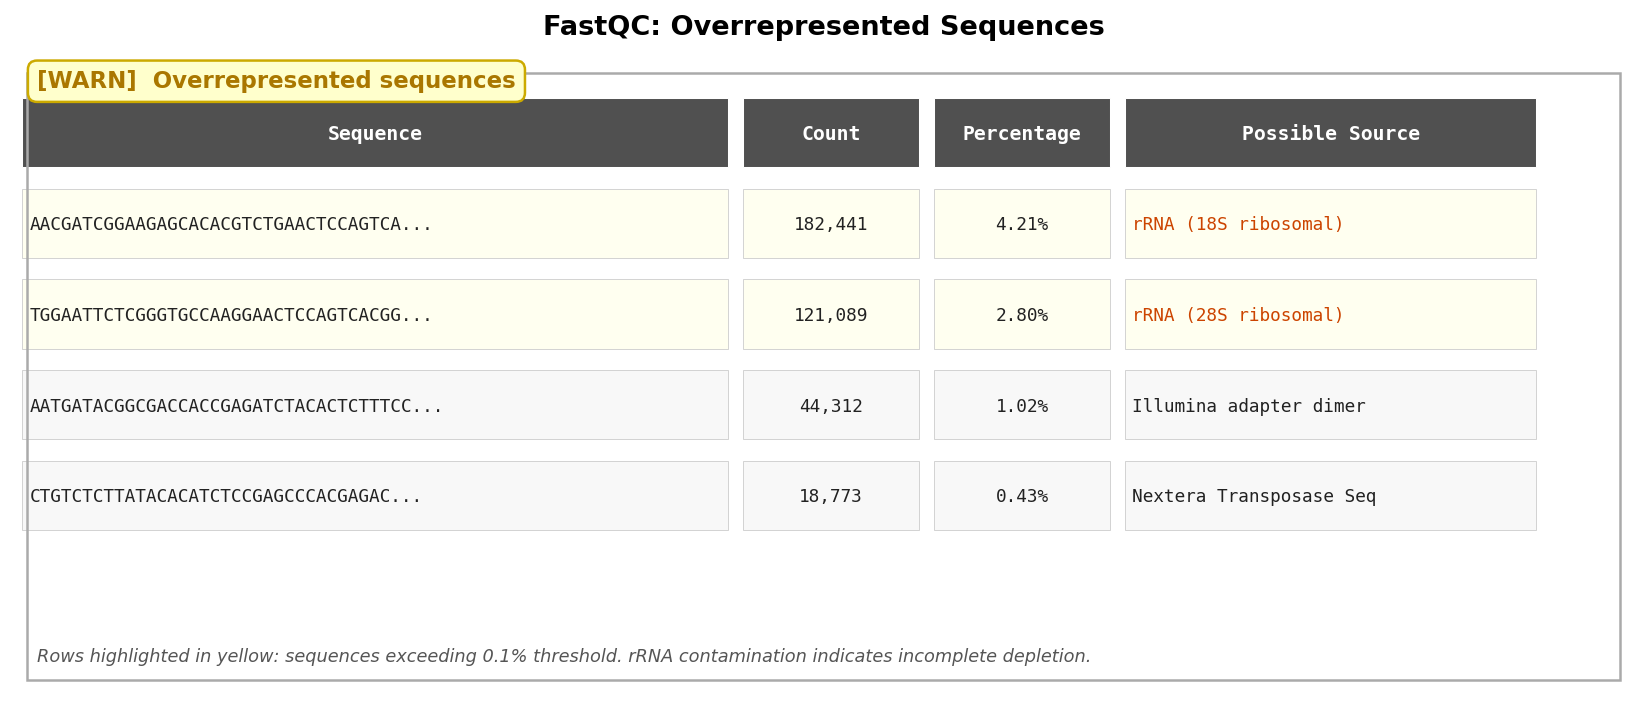
The overrepresented sequences module lists reads that appear with disproportionate frequency in your library. FastQC tries to identify them by matching against a small database of common contaminants.
The most important hit to watch for is ribosomal RNA. If FastQC identifies overrepresented sequences that BLAST to rRNA, your rRNA depletion step failed or was insufficient. In a well-prepared poly(A)-selected library, rRNA should be vanishingly rare. In a total-RNA library that was supposed to be ribo-depleted, rRNA fractions above a few percent mean your depletion kit did not work as expected.
High rRNA contamination is not always catastrophic, but it does waste your sequencing depth. Every read that maps to an rRNA gene is a read that did not map to your gene of interest. If 30 percent of your reads are rRNA, you effectively lost 30 percent of your sequencing run.
A second common hit is adapter dimers, short sequences that arise when two adapter molecules ligate directly to each other without an insert. Adapter dimers map nowhere in the genome, inflate your unmapped-read fraction, and are a sign of low-quality library preparation.
The Decision Tree: What To Do With What You Found
By this point you have a picture of your library. Now you need to make a decision. The decision is not binary.
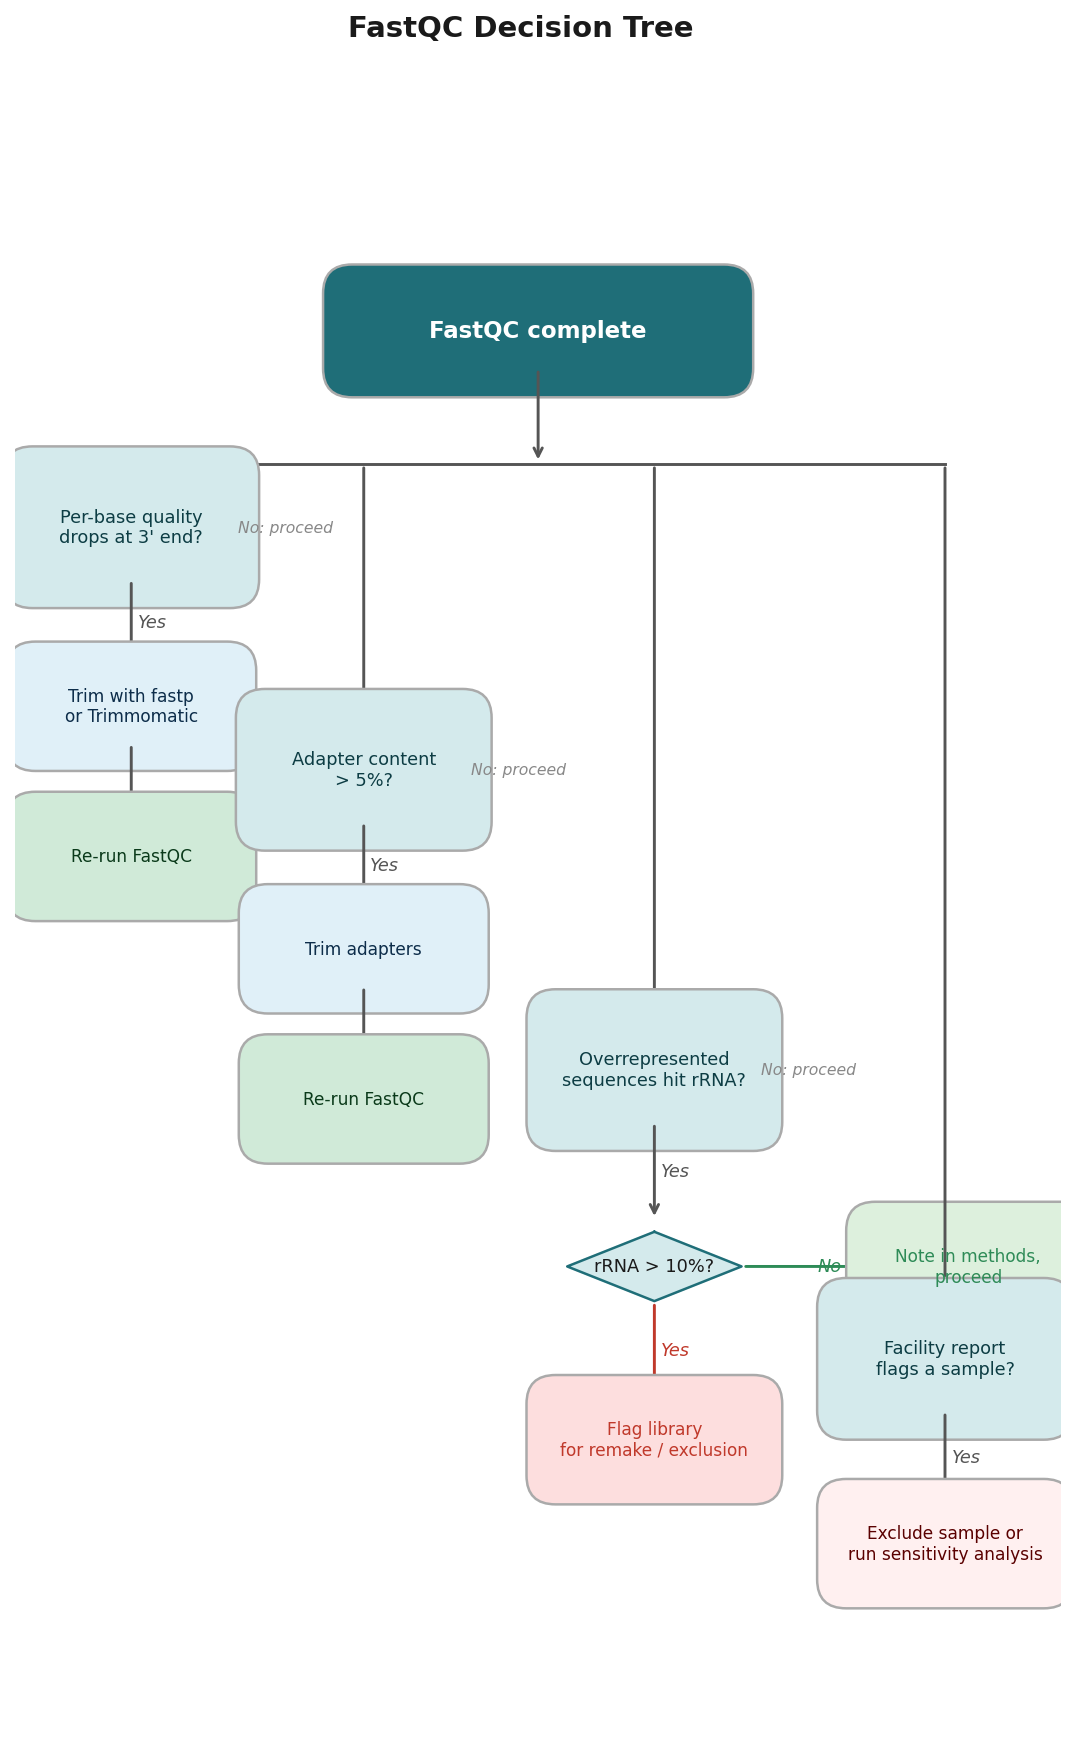
If per-base quality is poor from position 1: contact the sequencing facility. You may be looking at a flow cell problem, and re-sequencing may be warranted.
If per-base quality drops steeply at the 3’ end: trim with fastp or Trimmomatic. For most RNA-seq libraries, fastp --detect_adapter_for_pe --cut_tail will handle it in one pass. Rerun FastQC after trimming to confirm improvement.
If adapter content is high: trim. Same tools. Same verification step.
If sequence duplication is high: do not panic, do not deduplicate blindly. Look at the library type and input amount. If both are standard, proceed.
If overrepresented sequences hit rRNA: note the percentage in your methods section and flag it to your PI. If it is above 10 percent, the library may need to be remade.
If everything looks good in your FastQC but the facility report flagged a sample: trust the facility report. Exclude the sample from downstream analysis or, at minimum, run your analysis with and without it and compare the results.
Getting Your QC Right From The Start
Reading FastQC well is a skill that takes practice. The first time you see a per-base quality drop, you do not know whether it is normal or alarming. The second time, you compare it to the first. By the tenth sample, you develop a calibrated sense for what your specific protocol and sequencing platform typically produces.
Until then, the safest habit is to read every module with a concrete question in mind rather than scanning for red flags. Ask: is the quality drop at the 3’ end within the expected range for this read length? Is the adapter content consistent with the insert size distribution I expect from this library prep? Are the overrepresented sequences biologically plausible given my sample type?
The answers to those questions tell you more than any color-coded grid.
If you want to skip the manual setup entirely, NotchBio runs FastQC and MultiQC automatically on every upload and surfaces plain-English warnings for the specific issues covered here: per-base quality drops that will affect alignment, adapter contamination above safe thresholds, rRNA fractions worth flagging, and discrepancies between your FastQC output and the facility report. You get the QC summary before the pipeline runs, not after.
Related Reading
Further reading
Read another related post
Publication-Ready RNA-Seq Plots in ggplot2
Reviewer-ready RNA-seq plots in R: volcano with gene labels, z-score heatmap with annotation bars, PCA with variance explained, and journal export settings.
Research GuideThe One-Bioinformatician Problem: Stop Being The Bottleneck
If you are the only bioinformatician serving multiple PIs, you are the bottleneck. Here is how to scale with templates, self-service, and clear handoffs.
TutorialORA vs GSEA: A Side-by-Side Tutorial in R with clusterProfiler
ORA and GSEA answer different questions. A working clusterProfiler tutorial with FDR correction, proper backgrounds, and side-by-side result interpretation.