Why Cell Line RNA-Seq Experiments Fail: Passage, Mycoplasma, and Culture Batch Effects
Cell lines are the default model system for bulk RNA-seq. They are tractable, reproducible in principle, and cheap to scale. The problem is that in practice, they are reproducible only if you control a set of variables that most labs track informally if at all. Passage number, mycoplasma status, serum lot, seeding density, flask surface type, and CO2 calibration can all shift the transcriptome significantly without triggering any obvious phenotypic alarm. Your cells look fine under the microscope. Your RNA quality scores look fine on the Bioanalyzer. Your alignment rates look fine in MultiQC. But the gene list you call significant reflects culture conditions as much as it reflects your treatment.
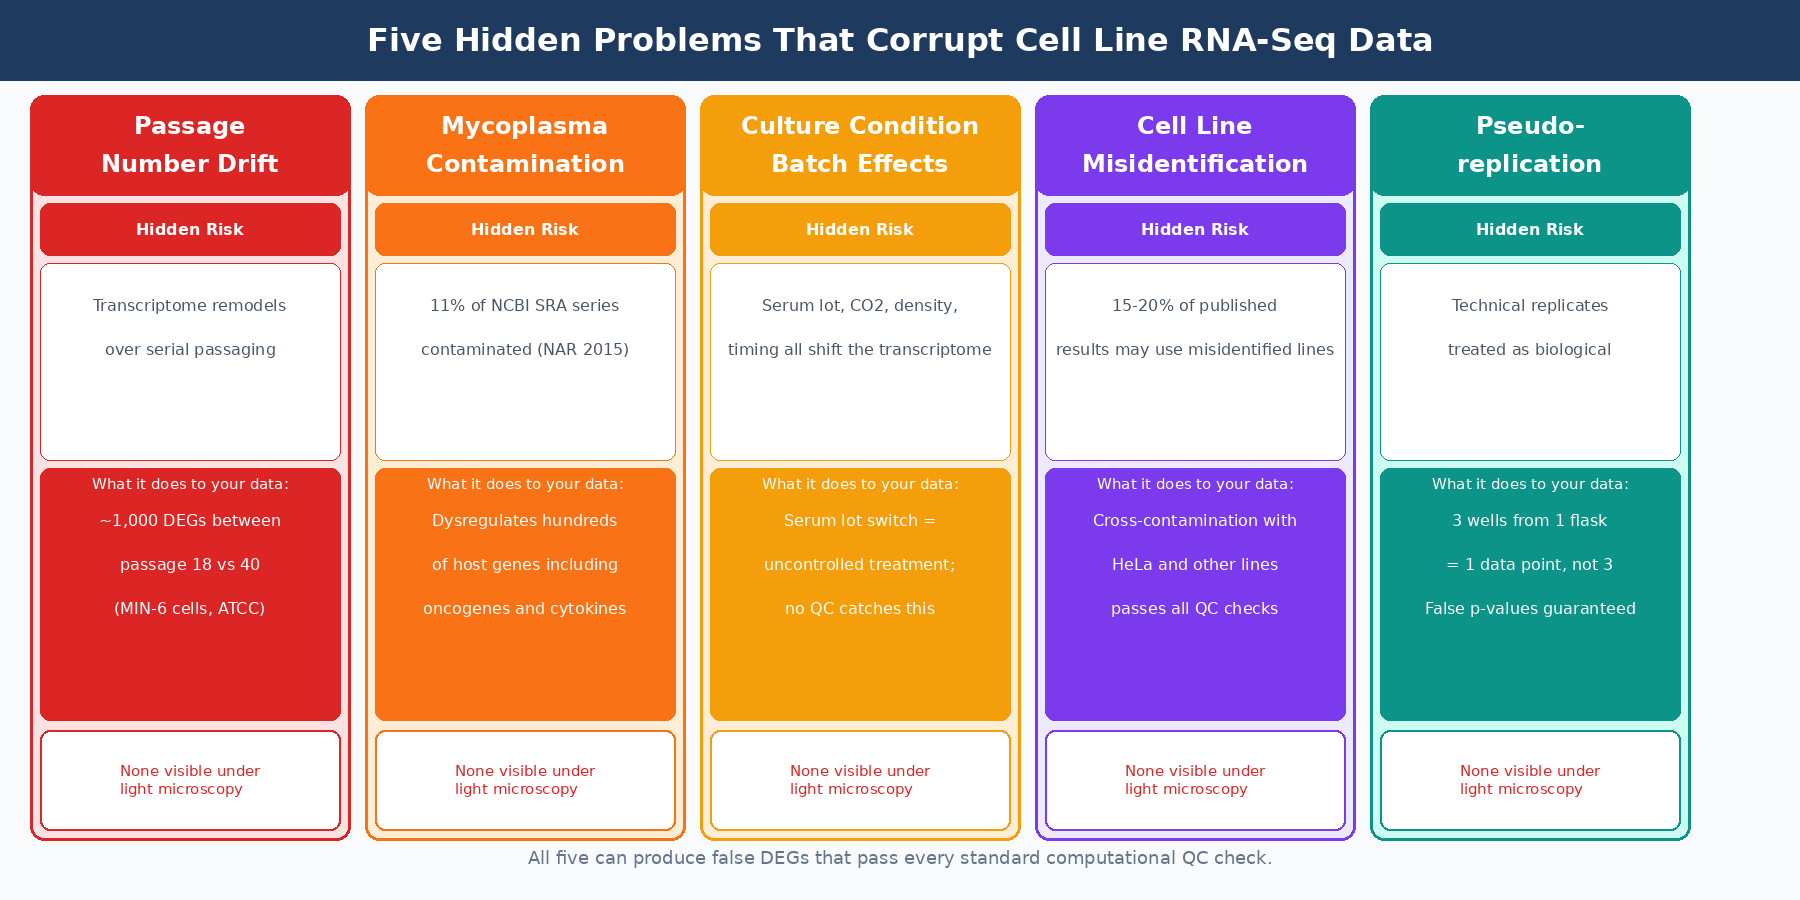
This post covers the five most consequential hidden variables in cell line RNA-seq, what each one does to your data, and what checks you should run before your experiment starts.
For the downstream statistics these choices corrupt, pair this with Experimental Design Mistakes That Kill Your Differential Expression Analysis and Batch Effects: The Silent Killer of RNA-Seq Studies.
Why Cell Line RNA-Seq Is Harder Than It Looks
Tissue RNA-seq has a built-in constraint: you extract from a defined biological sample that, in principle, reflects biological variation among organisms. Cell line RNA-seq has no such constraint. The cells themselves are a variable. Every sub-culture decision, every reagent lot switch, every temperature excursion in the incubator, every plate the cells sit in is an experimental condition that changes the transcriptome.
This does not make cell lines unusable. It makes them a controlled system that requires deliberate control. The variables that destroy reproducibility in cell line RNA-seq are not mysterious. They are documented. Most of them are straightforward to manage if you know they exist.
Does Cell Passage Number Affect Gene Expression?
Yes, measurably, and the effect compounds over time.
A 2025 Scientific Reports study continuously cultured two tumor cell lines, ACHN and Renca, and sequenced them at passages 3, 10, 17, 24, and 39. Principal component analysis showed that cells gradually dispersed in principal component space with increasing passages, indicating significant alterations in gene expression profiles over serial passaging. Sample correlation heatmaps confirmed progressive transcriptomic divergence across different passages, supporting systematic remodeling of the transcriptome during long-term culture (Scientific Reports, 2025).
The biological mechanism is not subtle. Cells in culture are under constant evolutionary pressure. Each passage is a selection event: cells that divide faster outcompete cells that divide more slowly, and the faster-dividing subpopulation is often the one that has accumulated mutations or epigenetic changes that deregulate growth pathways. Over many passages, the population drifts away from the original biology and toward a stable in-vitro-adapted phenotype.
An ATCC technical document summarizing passage-related effects across published literature reports that a study on MIN-6 cells found almost 1,000 genes differentially expressed between low-passage (passage 18) and high-passage (passage 40) cells, including genes involved in regulated secretion, adhesion, and proliferation. The same document cites a study on LNCaP prostate cancer cells showing that the PI3K/Akt pathway’s regulation of androgen receptor activity changed in a passage-number-dependent manner between passage 25 and passage 60 (ATCC Technical Document).
High passage numbers are not just a quality issue — they are an experimental design problem
If your control cells were at passage 15 when you bought them, and your treated cells were at passage 28 six months later, any transcriptomic differences between the two groups reflect passage drift as well as treatment. This is confounding, not batch effect. It cannot be corrected computationally.
What to do: Record passage number for every sample. Keep it within a five-passage window across all samples in an experiment. Thaw fresh cells from a validated, low-passage stock at the start of any multi-month study. If you cannot control passage within a narrow range, include passage number as a covariate in your design matrix.
How to Detect Mycoplasma Contamination Affecting RNA-Seq
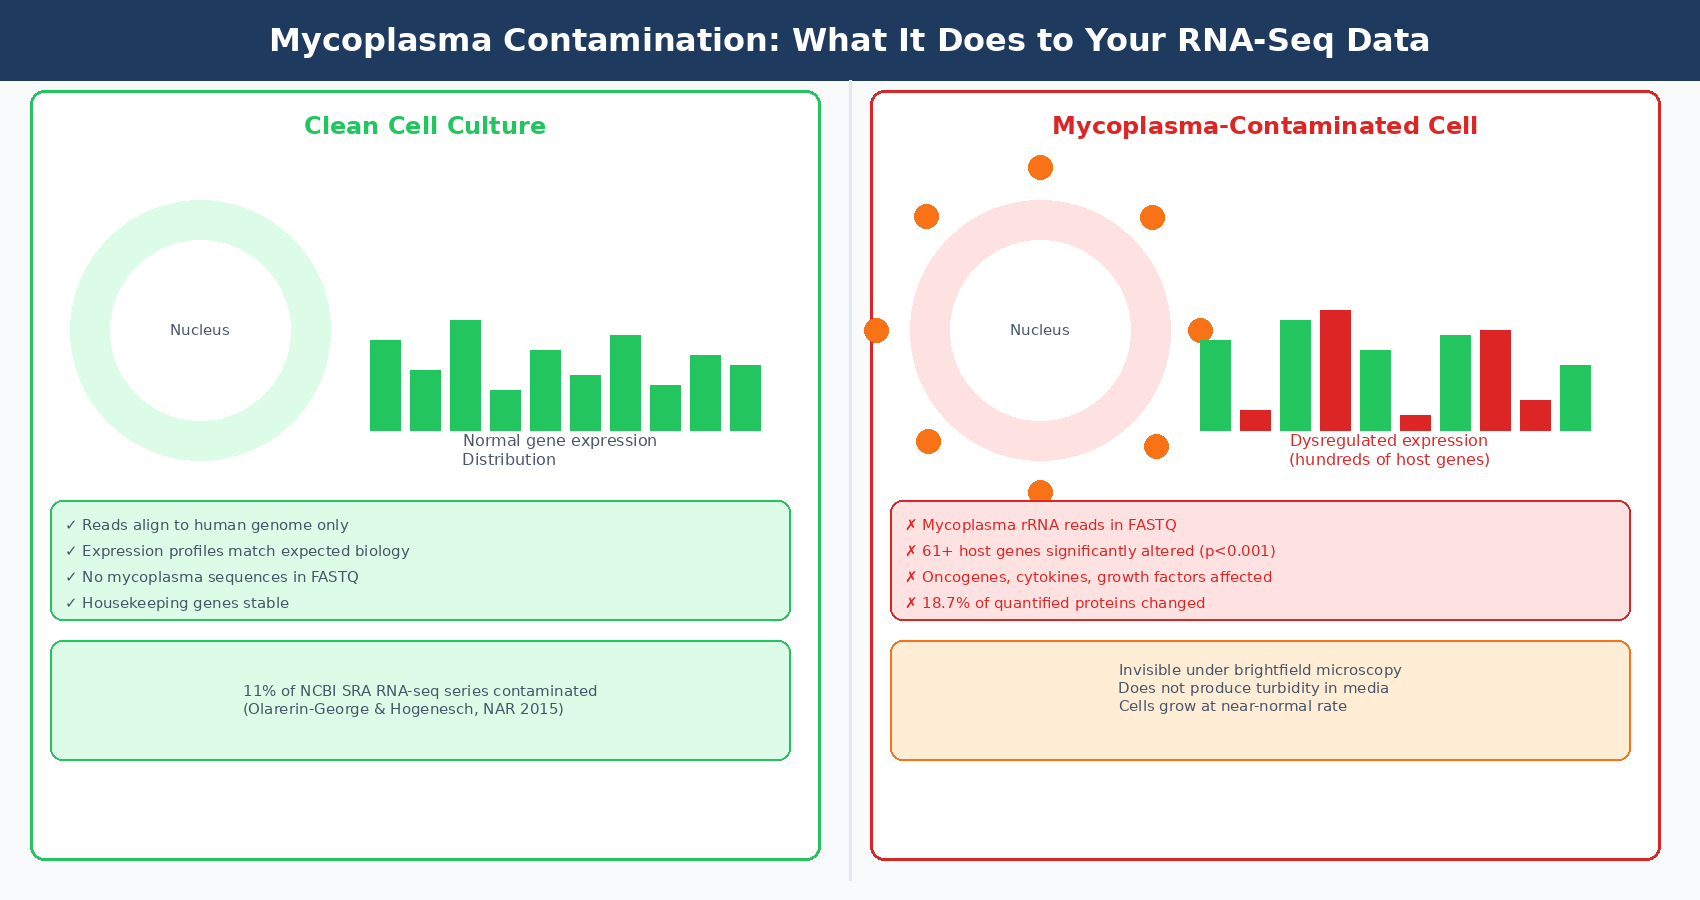
Mycoplasma contamination is the most underappreciated threat to cell line RNA-seq. It is invisible to the naked eye, invisible under a standard brightfield microscope, and invisible in routine culture media. Contaminated cells often grow normally, proliferate at normal rates, and show no gross morphological changes. The transcriptome, however, is quietly remodeled.
A landmark study analyzed 9,395 rodent and primate RNA-seq samples from 884 series in the NCBI Sequence Read Archive and found that 11% of these series were contaminated, defined as at least 100 reads per million mapping to mycoplasma in one or more samples. In contaminated samples, 61 host genes were significantly associated with mycoplasma-mapped read counts at p < 0.001. The contamination was prevalent even in series that used poly-A selection for library preparation, which should in theory reduce bacterial RNA enrichment (Nucleic Acids Research, 2015).
Why does mycoplasma disrupt host gene expression so profoundly? Mycoplasmas have some of the smallest prokaryotic genomes (roughly 0.6 megabases) and lack genes for synthesizing their own macromolecule precursors. They survive by co-opting host cell resources: competing for arginine, depleting ATP, degrading host DNA with their own endonucleases, and fusing with the host cell membrane. The net result is that mycoplasma infection dysregulates hundreds of host genes including oncogenes, tumor suppressors, cytokines, growth factors, receptors, and ion channels (Nucleic Acids Research, 2015; InvivoGen review).
At the protein level, a study on leukemic cell lines found that 18.7% of 235 quantified proteins changed significantly between mycoplasma-infected and never-infected cell line samples (PMC6269355). That is not subtle noise. That is nearly one in five proteins at altered expression levels, distributed across signaling, metabolic, and immune pathways.
How to detect it in your data: Align a subset of reads against mycoplasma reference genomes (Mycoplasma fermentans, M. hyorhinis, M. orale, M. genitalium are the most common cell culture contaminants). Tools like Kraken2 can classify reads against a curated microbial database. If you see even 100 mycoplasma-mapped reads per million, the contamination is real and the transcriptomic damage is already done.
How to prevent it: Test every cell line upon receipt using a validated PCR-based mycoplasma detection kit, and retest every six months. Never share reagents or pipettes between cell lines without autoclaving. Never use cells from a lab that does not test routinely. If contamination is found, discard and rethaw from a clean stock rather than attempting antibiotic treatment on cells you intend to sequence.
Antibiotic-treated cells should not be used for RNA-seq
Common mycoplasma elimination treatments like BM-Cyclin alter gene expression in ways that persist after treatment. A study using RNA-seq found that anti-mycoplasma treatment only partially reversed the transcriptional changes caused by contamination. If your cells were contaminated and treated, do not trust the transcriptome. Rethaw from a clean, validated stock.
Culture Condition Batch Effects in Cell Line Experiments
Beyond passage and contamination, routine differences in culture conditions between experiments — or even between replicates within the same experiment — produce measurable batch effects in gene expression.
When these hidden variables dominate PC1 or split replicates in a distance heatmap, the diagnostic patterns look exactly like the ones in PCA and Clustering for RNA-Seq QC in Python.
The variables most likely to shift the transcriptome without triggering observable phenotypic change are:
Serum lot. Fetal bovine serum (FBS) is biologically variable between lots. Different lots contain different growth factor concentrations, different hormone levels, and different complement activity. A serum lot change mid-experiment is effectively an uncontrolled treatment. Labs that run experiments over months without reserving a single lot of serum routinely confound serum lot with treatment in ways that are impossible to correct downstream.
Seeding density. Gene expression is sensitive to cell density through contact inhibition, paracrine signaling, and nutrient depletion kinetics. Cells seeded at different densities and harvested at the same time point are not in the same physiological state, even if they look confluent. A 30% difference in seeding density can produce measurable transcriptomic differences at harvest.
Passage timing and duration. The length of time between seeding and harvest, and whether cells went through an additional division cycle, affects cell cycle distribution at the time of lysis. Cell cycle phase is a major axis of transcriptomic variation. Cells harvested mid-exponential growth and cells harvested near stationary phase have profoundly different transcriptomes.
CO2 and temperature calibration. Incubator calibration drifts. An incubator running at 5.5% CO2 instead of 5.0% shifts media pH, which alters amino acid uptake and basic metabolic gene expression. This is not dramatic enough to kill cells or alter proliferation measurably, but it is easily large enough to shift dozens of transcripts.
| Culture Variable | Transcriptomic Risk | Detection Method | Prevention |
|---|---|---|---|
| Serum lot change | High: growth factor signaling genes | Reserve one lot for full study | Purchase 6–12 months supply, validate before reserving |
| Passage number drift | High: cell cycle, metabolism, stress | PCA separates by passage | Record passage; keep within 5-passage window |
| Seeding density variation | Medium: cell cycle, contact inhibition | Count cells at harvest | Use consistent seeding and harvest density |
| Incubator CO2 drift | Low-medium: metabolic genes | pH indicator media color | Calibrate CO2 monthly; use certified standards |
| Mycoplasma contamination | Very high: hundreds of host genes | PCR test; read mapping to mycoplasma | Test every 6 months; never share reagents |
| Media lot change | Medium: nutrient-responsive genes | Plate log of lot numbers | Use same lot for full experiment |
Cell Line Misidentification and Cross-Contamination
The most extreme form of culture-condition error is discovering that your cells are not what you think they are. Cross-contamination of cell lines is a documented problem in biology, with HeLa cells notoriously responsible for a large fraction of cross-contamination events in the historical literature. A 2007 study estimated that 15 to 20% of published cell line results may have involved misidentified or cross-contaminated lines.
For RNA-seq, misidentification produces data that looks technically clean. The reads align, the counts distribute reasonably, the QC passes. But the gene expression profile corresponds to a different cell type than your experimental label claims. When you compare “HEK293 treated” versus “HEK293 control” and the treated cells are actually a cervical carcinoma line, your DE list represents a species difference, not a treatment response.
STR profiling before any significant experiment is now standard practice and required by most major journals. Short tandem repeat profiles are cell-line-specific DNA fingerprints that confirm identity. Cell lines obtained from external collaborators, purchased from non-primary sources, or not profiled in the previous year should be profiled before use. ATCC provides reference STR profiles for most common cell lines.
Pseudoreplication in Cell Line Experiments: Why Your Replicates Might Not Be Replicates
The final structural problem is pseudoreplication, which applies to cell lines in a specific and common way. Three wells from the same flask, harvested on the same day, from the same passage of the same cell line, are not three biological replicates. They are three technical replicates of one biological replicate.
True biological replicates for cell line experiments require independent derivation events: cells thawed on different days from the same stock, carried independently for the same number of passages, seeded and treated in separate incubator experiments. This is the only design that captures genuine biological variation in the line and allows DESeq2’s dispersion model to function correctly.
Technical variance in cell lines is much lower than biological variance. When you treat technical replicates as biological replicates, DESeq2’s dispersion estimates are too small, your p-values are inflated, and your gene list is far longer than the biology justifies. The number of false discoveries can be enormous. A reanalysis of a pseudoreplication problem in single-cell data found that the inflated DE gene count was 549-fold higher than a properly structured analysis, though that is an extreme case (PMC10695556). In bulk cell line experiments the inflation is more modest but structurally identical.
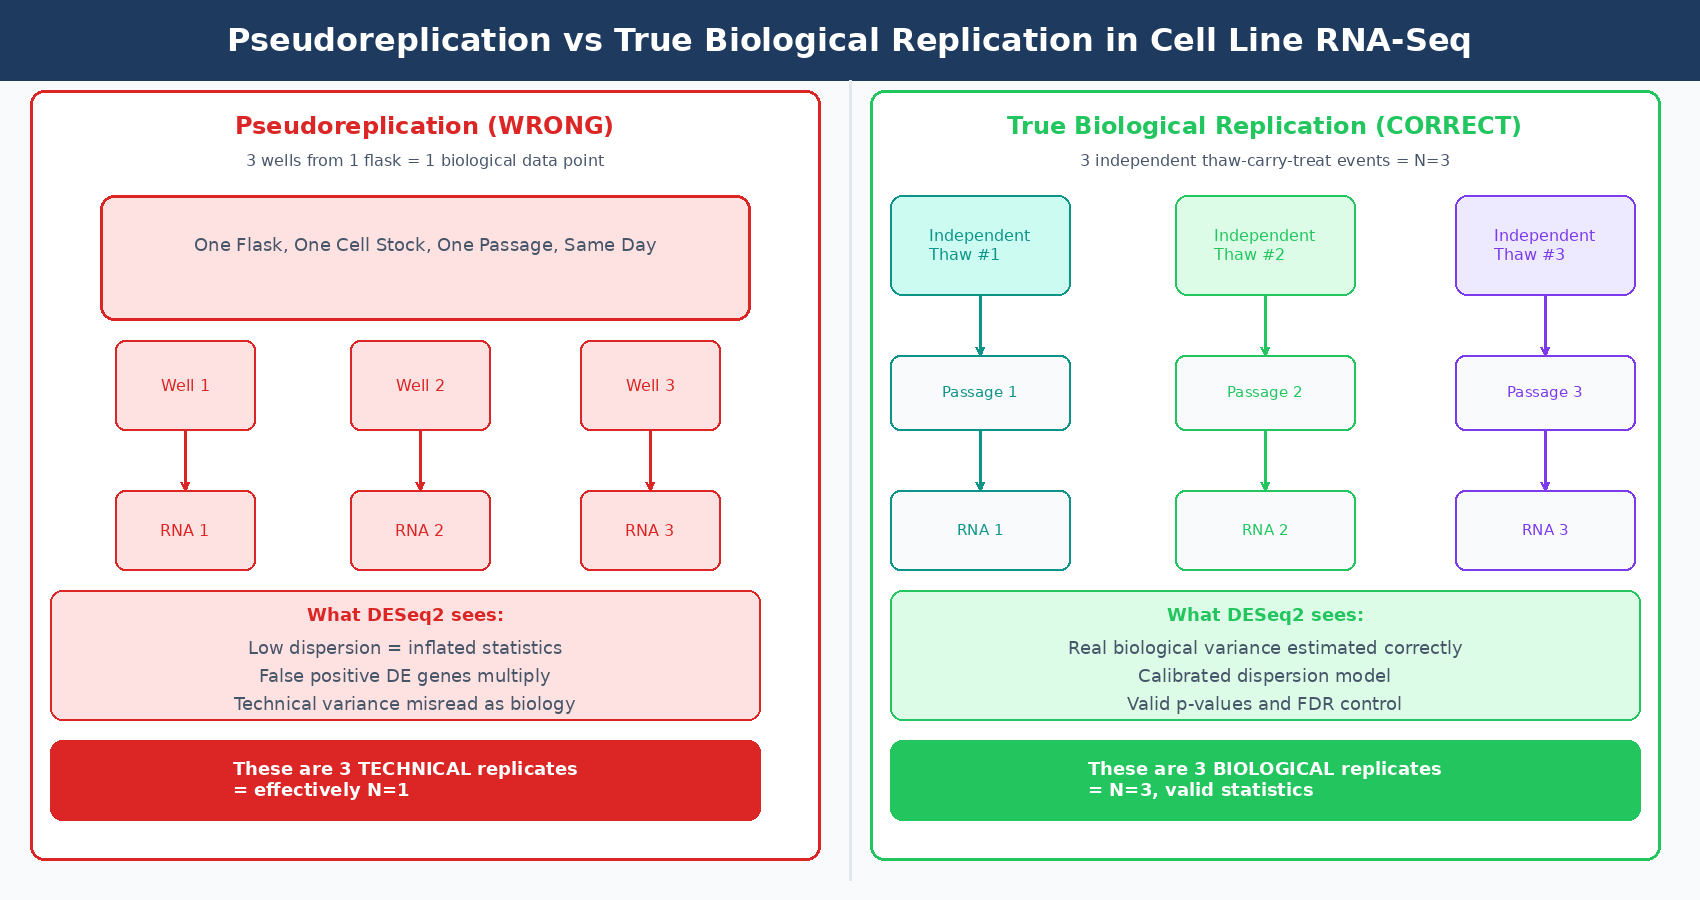
What a valid cell line RNA-seq biological replicate looks like: cells thawed independently from a validated, mycoplasma-free, low-passage stock; carried in isolation (different incubator space or clearly separate treatment in the same incubator) for a defined number of passages; treated and harvested on potentially different days by the same or different operators. Each replicate is a separate biological event, not a sub-sampling of one biological event.
A Pre-Experiment Cell Line Checklist
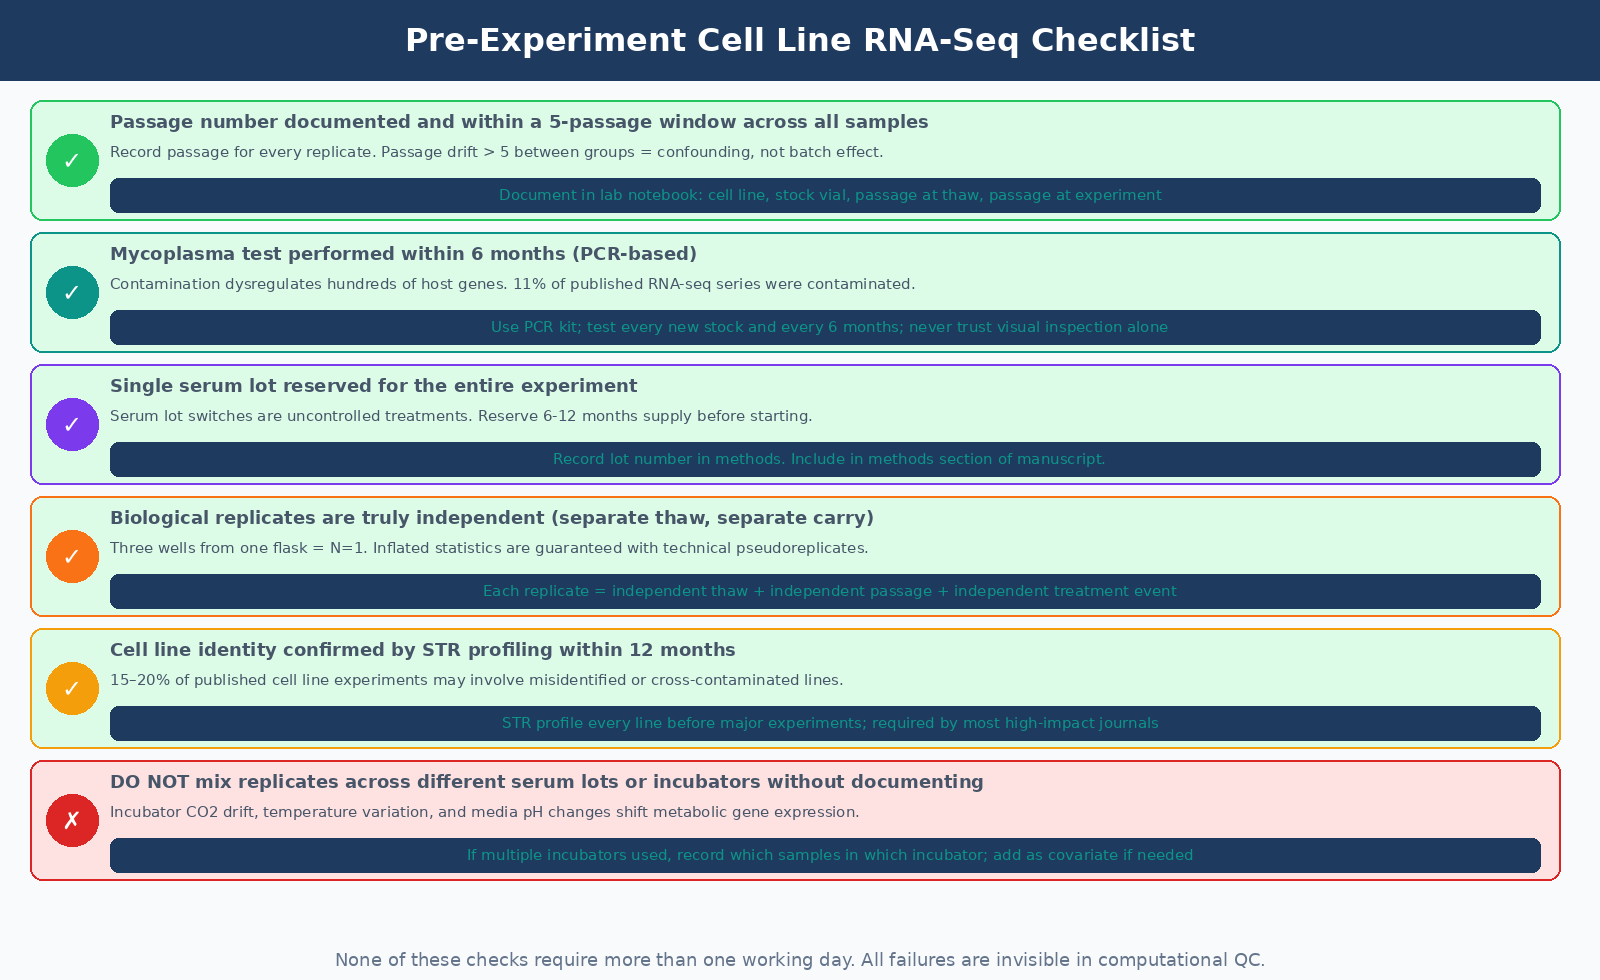
Before extracting RNA from your first sample, six questions should have documented answers:
What is the passage number of each replicate, and are they within a five-passage window? If the answer involves cells from wildly different passages, the transcriptomes are not from the same population.
Has each cell stock been tested for mycoplasma within the last six months? PCR-based testing takes one day and costs less than one sample worth of sequencing. There is no justification for skipping it.
Were all replicates grown with the same serum lot? Reserve a single lot before the study starts. Record the lot number in your methods.
Are your replicates truly biologically independent? Three wells from one flask is one data point, not three. The design must include independently initiated cultures.
Has the cell line identity been confirmed by STR profiling? If not, profile before the experiment.
Are your incubators calibrated and CO2-checked? Not essential for all experiments, but if replicates are across different incubators, check calibration and record it.
The computational analysis of a cell line RNA-seq experiment cannot rescue poor experimental practice. DESeq2 will model what you give it. If you give it technical replicates labeled as biological replicates, it will produce a result. If you give it mycoplasma-contaminated cells, it will produce a result. If you give it cells at passage 40 compared to cells at passage 15, it will produce a result. None of those results tell you what you think they are telling you about your treatment.
NotchBio runs the full bulk RNA-seq pipeline from FASTQ to differential expression results and includes a microbial contamination screening step as part of QC. If mycoplasma reads are detected in your samples, the pipeline flags it before the analysis proceeds. If you want a pipeline that catches these problems computationally rather than after the fact, start at notchbio.app.
Further reading
Read another related post
From Wet Lab to Dry Lab: A Realistic Map of What to Learn First
A practical skill sequence for wet-lab biologists learning RNA-seq analysis: what to prioritise, what to safely skip, and what to outsource while you build.
BioinformaticsWhat FastQC Reports Actually Tell You (And What Beginners Miss)
A senior bioinformatician walks through the FastQC sections that real beginners miss, with screenshots and decisions to make at each step.
Research GuideWhy Most Published GO Analyses Are Statistically Wrong
A 2022 PLOS Computational Biology study found 43% of GO enrichment analyses skip multiple test correction. Here is what that means and how to do it right.