Why Most Published GO Analyses Are Statistically Wrong
In 2022, Wijesooriya and colleagues published a systematic review of gene ontology enrichment analyses across 186 published papers in PLOS Computational Biology. Their finding was uncomfortable: fewer than 20 percent of analyses were reproducible, and 43 percent of papers failed to apply multiple testing correction at all. These were not preprints or low-tier journals. Many came from well-funded labs publishing in respected venues.
If you have run a GO analysis, there is a better-than-even chance you have made at least one of the mistakes that study documents. That is not a personal failing. It is a consequence of tools that quietly mislead and a field that has never enforced standards the way clinical statistics does. Understanding the mistakes, and the reasoning behind the correct approach, is the only reliable fix.
What the Wijesooriya Study Actually Found
The paper examined papers spanning 2000 to 2020 and evaluated them against a set of statistical and methodological criteria. The headline numbers are damning enough: 43 percent of analyses omitted multiple testing correction entirely, meaning they reported raw p-values as if each GO term were being tested in isolation. They were not. A standard GO analysis tests hundreds to thousands of terms simultaneously. Running that many tests guarantees false positives even if your gene list is random noise.
Beyond the correction issue, the study found widespread problems with background set selection. Many analyses used the entire human genome as the background for a test that was run on data from a specific tissue or cell type, where thousands of genes are not expressed at all. Using a background that includes genes your experiment could never have detected inflates your apparent enrichment signal. The terms that survive look biologically specific; they are often statistical artifacts of a poorly chosen universe.
Less than 20 percent of analyzed papers provided enough methodological detail that an independent group could reproduce the analysis. That figure includes tool name, version, parameter choices, and the exact gene list used as input. Most papers reported the result without the scaffolding needed to verify it.
43 percent of published GO analyses skip multiple test correction
A 2022 PLOS Computational Biology systematic review found that nearly half of published gene ontology enrichment analyses did not apply FDR correction. Without it, running hundreds of simultaneous GO term tests guarantees false positives. Every GO analysis you publish should report adjusted p-values, not raw ones.
Why Multiple Testing Correction Is Not Optional
When you run a GO enrichment test, you are simultaneously asking whether your gene list is enriched for GO:0006915 (apoptotic process), GO:0007049 (cell cycle), GO:0006955 (immune response), and hundreds of others. Each test has some probability of returning a false positive. At a p-value threshold of 0.05, you expect one false positive for every 20 tests run purely by chance.
A typical GO analysis tests 500 to 5,000 terms depending on the organism and ontology. At 1,000 tests with no correction, you expect 50 significant results even if your gene list was drawn at random. Without correction, your top enriched terms are almost guaranteed to include noise. The noise is indistinguishable from signal unless you have correction applied.
The Benjamini-Hochberg procedure, which controls the false discovery rate rather than the familywise error rate, is the standard for this kind of analysis. It is less conservative than Bonferroni, which is appropriate because GO terms are not independent; parent and child terms share genes. Benjamini-Hochberg handles correlated tests reasonably well and is what most bioinformatics tools implement when you ask for FDR correction.
The practical consequence of skipping this step is not subtle. I have seen analyses where the uncorrected top hit was “nucleosome assembly,” which appeared because the gene list happened to contain a cluster of histone genes that share a GO annotation. After Benjamini-Hochberg correction, that term disappeared entirely. The biological story the authors had built around it collapsed.
Background Sets: The Mistake That Looks Invisible
Even with correct FDR adjustment, a GO analysis can be wrong if the background gene set is wrong.
The background represents the universe of genes that could theoretically have appeared in your result. If you are testing a list of 300 upregulated genes from a liver RNA-seq experiment, the appropriate background is all genes that were expressed in your liver samples, not the full annotated genome. Using the full genome as background biases the test because it inflates the denominator in the hypergeometric calculation, making terms look enriched when they are not.
The correct background is the set of genes that passed your expression filter before any fold-change or significance thresholding. In DESeq2, that is every gene with a non-NA adjusted p-value, which DESeq2 reports for all genes that had sufficient counts to be tested. In edgeR, it is everything that survived the filterByExpr step. That is your background. Pass it explicitly to every enrichment function you call.
Tools like DAVID let you paste a gene list without specifying a background and will silently use the full genome. clusterProfiler requires a background argument in its enrichGO function, but the default in older documentation examples often omits it. Both lead to the same problem: your top enriched terms are driven by how well-annotated a term is in the GO database relative to the genome as a whole, not by the biology of your experiment.
ORA vs GSEA: The Method That Should Be Your Default for Publication
Over-representation analysis (ORA) asks whether genes from a predefined GO term appear in your DEG list more often than expected by chance. It requires a binary input: a list of significant genes and a background. It is simple, fast, and widely understood.
Gene Set Enrichment Analysis (GSEA) asks a different question: is a GO term systematically enriched at the top or bottom of a ranking of all your genes, sorted by differential expression statistic? It does not require a significance threshold. It uses your entire gene list, ordered from most upregulated to most downregulated, and tests whether genes from each GO term cluster toward the extremes of that ranking.
GSEA has two important advantages for RNA-seq. First, it avoids the arbitrary threshold problem that plagues ORA. With ORA, changing your padj cutoff from 0.05 to 0.01 changes which terms are significant. GSEA uses the continuous ranking so results are more stable. Second, GSEA is less sensitive to the background-set problem because it does not use a hypergeometric test at all. Every gene participates in the ranking regardless of whether it meets a fold-change threshold.
The practical tradeoff is that GSEA requires a ranked list from a reasonably powered experiment. With very small sample sizes or very few differentially expressed genes, the ranking is noisy and GSEA results can be unstable. ORA is sometimes the only viable option with low-power data.
For publication, GSEA is generally preferred by reviewers who know the field. If you must use ORA, use a properly specified background and report adjusted p-values.
| Feature | ORA | GSEA |
|---|---|---|
| Input required | DEG list + background | All genes ranked by stat |
| Threshold dependency | High (results change with cutoff) | Low (uses full ranking) |
| Background sensitivity | High (wrong background = wrong result) | Low (no hypergeometric test) |
| Works with low-power data | Yes | Caution (noisy ranking) |
| Preferred for publication | Acceptable if done correctly | Generally preferred |
| Multiple testing correction | Benjamini-Hochberg on adjusted p | FWER or FDR on NES |
Where Common Tools Go Wrong
DAVID is probably the most-used GO enrichment tool in biology. It is also, in my view, one of the most dangerous for a user who does not know what to look for. The default output shows both uncorrected p-values and Benjamini-Hochberg-corrected values, but the default sort is by uncorrected p-value. Many users copy the top rows without noticing that the Benjamini column tells a completely different story. DAVID also has not been updated with current gene annotation databases regularly, so its results may lag behind the current GO release.
KOBAS similarly outputs uncorrected and corrected p-values and requires the user to actively filter on the correct column. The defaults in the web interface are not conservative.
PANTHER is more careful about its defaults but its documentation on background selection is not explicit enough for users unfamiliar with the underlying statistics.
clusterProfiler in R, used correctly, is the most reliable option available. It requires you to specify the background explicitly, applies Benjamini-Hochberg by default, and integrates directly with DESeq2 and edgeR output. The learning curve is real, but the statistical behavior is transparent.
A Correct Workflow in clusterProfiler
The following R code demonstrates a minimal correct ORA workflow. It assumes you have run DESeq2 and have a results object called dge_results.
library(clusterProfiler)library(org.Hs.eg.db)
# All genes that were tested (non-NA padj) = your backgroundbackground_genes <- rownames(dge_results[!is.na(dge_results$padj), ])
# Significant genes at padj < 0.05 and |log2FC| >= 1sig_genes <- rownames(dge_results[  !is.na(dge_results$padj) &  dge_results$padj < 0.05 &  abs(dge_results$log2FoldChange) >= 1, ])
# Run ORA with explicit background and Biological Process ontologyora_result <- enrichGO(  gene          = sig_genes,  universe      = background_genes,   # explicit background, not the default genome  OrgDb         = org.Hs.eg.db,  keyType       = "ENSEMBL",  ont           = "BP",  pAdjustMethod = "BH",               # Benjamini-Hochberg  pvalueCutoff  = 0.05,  qvalueCutoff  = 0.2,  readable      = TRUE)
For GSEA, the input changes to a ranked vector of all tested genes, sorted by the DESeq2 Wald statistic:
# Build a named numeric vector: gene ID -> Wald statisticwald_stats <- dge_results$statnames(wald_stats) <- rownames(dge_results)
# Remove NAs and sort descendingwald_stats <- sort(na.omit(wald_stats), decreasing = TRUE)
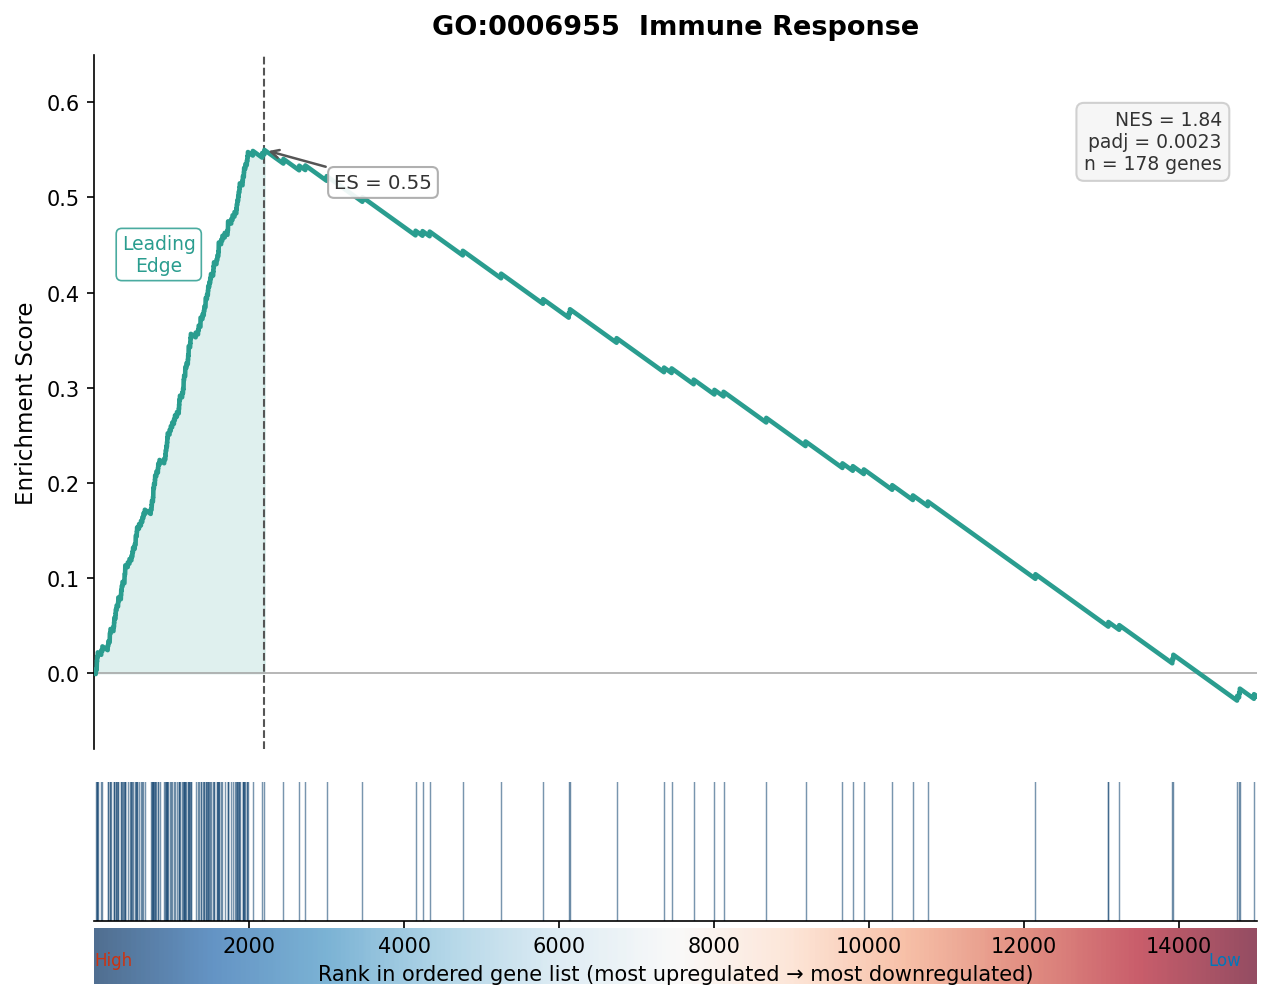
# Run GSEA with the full ranked listgsea_result <- gseGO( geneList = wald_stats, OrgDb = org.Hs.eg.db, keyType = "ENSEMBL", ont = "BP", minGSSize = 10, maxGSSize = 500, pvalueCutoff = 0.05, verbose = FALSE)The enrichment plot below shows what a valid GSEA result looks like: a clear running sum that rises or falls monotonically at one end of the ranked list, with a well-separated leading edge.
Making Your Analysis Defensible
The standard that should govern every published GO analysis is simple: could an independent researcher reproduce your result from the methods you described? That requires, at minimum, the name and version of the tool you used, the exact gene list or ranking you provided as input, the background set you specified (and how you defined it), the ontology and statistical method you chose, and the adjusted p-value threshold you applied.
None of this is burdensome to report. The information already exists in your code. The effort is in deciding to include it.
If you are not sure whether your current enrichment workflow meets this standard, run a quick sanity check: take a randomly shuffled version of your gene list and run the same analysis. If you get significant results, your background is wrong, your correction is missing, or both.
NotchBio runs both ORA and GSEA in parallel on every dataset, applies Benjamini-Hochberg correction by default, uses the tested gene universe as the background automatically, and outputs a methods paragraph that includes tool versions and parameter choices. If you want your enrichment results to survive peer review, those are the boxes that need to be checked.
Related Reading
Further reading
Read another related post
How DESeq2 Actually Works (Without the Math Overload)
The negative binomial model, size factors, dispersion shrinkage, and what each output column really means: DESeq2 explained for working researchers.
Research GuideDetecting Batch Effects with PCA and Correcting Them in DESeq2
How to detect batch effects with a PCA plot and correct them in DESeq2 using a design covariate, ComBat-seq, and limma removeBatchEffect for visualization.
Research GuideWhat Is a Count Matrix and Why Does It Matter
Raw counts, TPM, FPKM, and DESeq2-normalized values each represent expression differently. What each one is, why it matters, and which to use downstream.